 The new release helps identify more performance issues, and makes it easier to understand and fix them.
The new Nsight Compute 2021.2 release helps identify more performance issues, and makes it easier to understand and fix them.
Register Dependency Visualization
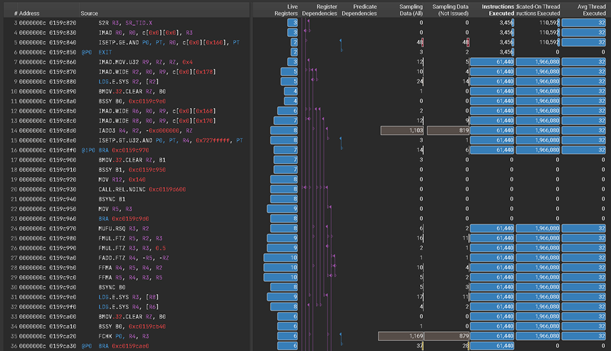
This latest release adds a new feature for register dependency visualization. It helps identify long dependency chains and inefficient register usage that can limit performance. The SASS view in the Source page has new columns that track all the potential writes for a register each time it is read. Columns show all dependencies for registers, predicates, uniform registers and uniform predicates.

Standalone Source Viewer
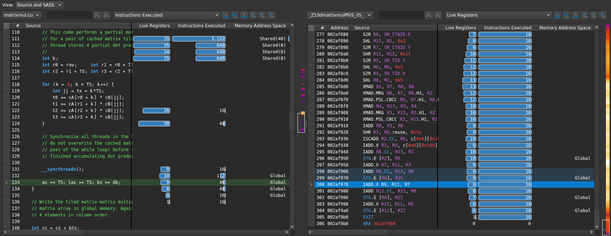
Developers have frequently requested this feature to allow the view of side-by-side assembly and correlated source code for CUDA kernels in the Source page without needing to collect a profile. Users can directly open .cubin files from disk in the GUI to see the code correlation. This feature helps users understand how their code is being translated into assembly by the compiler and can be used to identify compiler optimizations and inefficiencies.

Guided Analysis Improvements
Several other features have been added to improve the guided analysis experience within the GUI. These include highlighted focus metrics, report cross-links, increased rule visibility and documentation references. These all add to the built-in profile and optimization guided analysis that Nsight Compute provides to help users understand and fix performance bottlenecks.

OptiX 7 Resource Tracking
In addition to existing Optix API tracing, this release provides support for tracking OptiX objects in the Resources tool window. OptiX 7 users can now see the properties and lifetime for objects like OptixDeviceContext, OptixProgramGroup, OptixDenoiser and more. Understanding when objects are created, destroyed, and interacted with can reveal unexpected behaviours that may cause performance or correctness issues in an OptiX application.

Additional Improvements
There have been additional improvements to management of baseline reports, font settings, CLI filters, and a new Python interface for reading report data. There is also support for tracking the new memory alloc/free nodes in CUDA graphs. For full details, see the latest release notes.
Resources:
Learn More & Download Now
Documentation
Forums
GTC On-Demand Session: “CUDA is Evolving, and the Latest Developer Tools are Adapting to Keep Up”
GTC On-Demand Session: “Requests, Wavefronts, Sectors Metrics: Understanding and Optimizing Memory-Bound Kernels with Nsight Compute”
Demo Video: New Nsight Systems and Nsight Compute Highlights
Additional instructional videos and blog posts for more information.
