Categories
Offsites

Announcing the first Machine Unlearning Challenge

Deep learning has recently driven tremendous progress in a wide array of applications, ranging from realistic image generation and impressive retrieval systems to language models that can hold human-like conversations. While this progress is very exciting, the widespread use of deep neural network models requires caution: as guided by Google’s AI Principles, we seek to develop AI technologies responsibly by understanding and mitigating potential risks, such as the propagation and amplification of unfair biases and protecting user privacy.

Fully erasing the influence of the data requested to be deleted is challenging since, aside from simply deleting it from databases where it’s stored, it also requires erasing the influence of that data on other artifacts such as trained machine learning models. Moreover, recent research [1, 2] has shown that in some cases it may be possible to infer with high accuracy whether an example was used to train a machine learning model using membership inference attacks (MIAs). This can raise privacy concerns, as it implies that even if an individual’s data is deleted from a database, it may still be possible to infer whether that individual’s data was used to train a model.

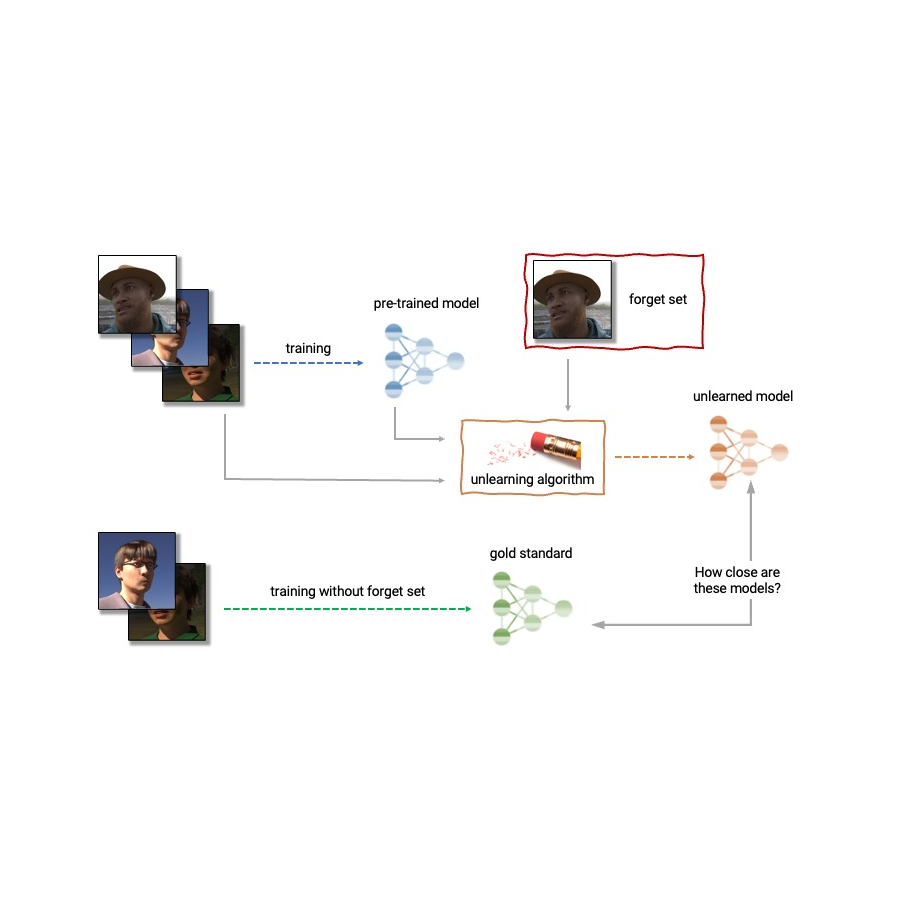
Given the above, machine unlearning is an emergent subfield of machine learning that aims to remove the influence of a specific subset of training examples — the “forget set” — from a trained model. Furthermore, an ideal unlearning algorithm would remove the influence of certain examples while maintaining other beneficial properties, such as the accuracy on the rest of the train set and generalization to held-out examples. A straightforward way to produce this unlearned model is to retrain the model on an adjusted training set that excludes the samples from the forget set. However, this is not always a viable option, as retraining deep models can be computationally expensive. An ideal unlearning algorithm would instead use the already-trained model as a starting point and efficiently make adjustments to remove the influence of the requested data.

Today we’re thrilled to announce that we’ve teamed up with a broad group of academic and industrial researchers to organize the first Machine Unlearning Challenge. The competition considers a realistic scenario in which after training, a certain subset of the training images must be forgotten to protect the privacy or rights of the individuals concerned. The competition will be hosted on Kaggle, and submissions will be automatically scored in terms of both forgetting quality and model utility. We hope that this competition will help advance the state of the art in machine unlearning and encourage the development of efficient, effective and ethical unlearning algorithms.

Machine unlearning applications

Machine unlearning has applications beyond protecting user privacy. For instance, one can use unlearning to erase inaccurate or outdated information from trained models (e.g., due to errors in labeling or changes in the environment) or remove harmful, manipulated, or outlier data.

The field of machine unlearning is related to other areas of machine learning such as differential privacy, life-long learning, and fairness. Differential privacy aims to guarantee that no particular training example has too large an influence on the trained model; a stronger goal compared to that of unlearning, which only requires erasing the influence of the designated forget set. Life-long learning research aims to design models that can learn continuously while maintaining previously-acquired skills. As work on unlearning progresses, it may also open additional ways to boost fairness in models, by correcting unfair biases or disparate treatment of members belonging to different groups (e.g., demographics, age groups, etc.).

Anatomy of unlearning. An unlearning algorithm takes as input a pre-trained model and one or more samples from the train set to unlearn (the “forget set”). From the model, forget set, and retain set, the unlearning algorithm produces an updated model. An ideal unlearning algorithm produces a model that is indistinguishable from the model trained without the forget set.

Challenges of machine unlearning

The problem of unlearning is complex and multifaceted as it involves several conflicting objectives: forgetting the requested data, maintaining the model’s utility (e.g., accuracy on retained and held-out data), and efficiency. Because of this, existing unlearning algorithms make different trade-offs. For example, full retraining achieves successful forgetting without damaging model utility, but with poor efficiency, while adding noise to the weights achieves forgetting at the expense of utility.

Furthermore, the evaluation of forgetting algorithms in the literature has so far been highly inconsistent. While some works report the classification accuracy on the samples to unlearn, others report distance to the fully retrained model, and yet others use the error rate of membership inference attacks as a metric for forgetting quality [4, 5, 6].

We believe that the inconsistency of evaluation metrics and the lack of a standardized protocol is a serious impediment to progress in the field — we are unable to make direct comparisons between different unlearning methods in the literature. This leaves us with a myopic view of the relative merits and drawbacks of different approaches, as well as open challenges and opportunities for developing improved algorithms. To address the issue of inconsistent evaluation and to advance the state of the art in the field of machine unlearning, we’ve teamed up with a broad group of academic and industrial researchers to organize the first unlearning challenge.

Announcing the first Machine Unlearning Challenge

We are pleased to announce the first Machine Unlearning Challenge, which will be held as part of the NeurIPS 2023 Competition Track. The goal of the competition is twofold. First, by unifying and standardizing the evaluation metrics for unlearning, we hope to identify the strengths and weaknesses of different algorithms through apples-to-apples comparisons. Second, by opening this competition to everyone, we hope to foster novel solutions and shed light on open challenges and opportunities.

The competition will be hosted on Kaggle and run between mid-July 2023 and mid-September 2023. As part of the competition, today we’re announcing the availability of the starting kit. This starting kit provides a foundation for participants to build and test their unlearning models on a toy dataset.

The competition considers a realistic scenario in which an age predictor has been trained on face images, and, after training, a certain subset of the training images must be forgotten to protect the privacy or rights of the individuals concerned. For this, we will make available as part of the starting kit a dataset of synthetic faces (samples shown below) and we’ll also use several real-face datasets for evaluation of submissions. The participants are asked to submit code that takes as input the trained predictor, the forget and retain sets, and outputs the weights of a predictor that has unlearned the designated forget set. We will evaluate submissions based on both the strength of the forgetting algorithm and model utility. We will also enforce a hard cut-off that rejects unlearning algorithms that run slower than a fraction of the time it takes to retrain. A valuable outcome of this competition will be to characterize the trade-offs of different unlearning algorithms.

Excerpt images from the Face Synthetics dataset together with age annotations. The competition considers the scenario in which an age predictor has been trained on face images like the above, and, after training, a certain subset of the training images must be forgotten.

For evaluating forgetting, we will use tools inspired by MIAs, such as LiRA. MIAs were first developed in the privacy and security literature and their goal is to infer which examples were part of the training set. Intuitively, if unlearning is successful, the unlearned model contains no traces of the forgotten examples, causing MIAs to fail: the attacker would be unable to infer that the forget set was, in fact, part of the original training set. In addition, we will also use statistical tests to quantify how different the distribution of unlearned models (produced by a particular submitted unlearning algorithm) is compared to the distribution of models retrained from scratch. For an ideal unlearning algorithm, these two will be indistinguishable.

Conclusion

Machine unlearning is a powerful tool that has the potential to address several open problems in machine learning. As research in this area continues, we hope to see new methods that are more efficient, effective, and responsible. We are thrilled to have the opportunity via this competition to spark interest in this field, and we are looking forward to sharing our insights and findings with the community.

Acknowledgements

The authors of this post are now part of Google DeepMind. We are writing this blog post on behalf of the organization team of the Unlearning Competition: Eleni Triantafillou*, Fabian Pedregosa* (*equal contribution), Meghdad Kurmanji, Kairan Zhao, Gintare Karolina Dziugaite, Peter Triantafillou, Ioannis Mitliagkas, Vincent Dumoulin, Lisheng Sun Hosoya, Peter Kairouz, Julio C. S. Jacques Junior, Jun Wan, Sergio Escalera and Isabelle Guyon.

Categories
Offsites

On-device diffusion plugins for conditioned text-to-image generation

In recent years, diffusion models have shown great success in text-to-image generation, achieving high image quality, improved inference performance, and expanding our creative inspiration. Nevertheless, it is still challenging to efficiently control the generation, especially with conditions that are difficult to describe with text.

Today, we announce MediaPipe diffusion plugins, which enable controllable text-to-image generation to be run on-device. Expanding upon our prior work on GPU inference for on-device large generative models, we introduce new low-cost solutions for controllable text-to-image generation that can be plugged into existing diffusion models and their Low-Rank Adaptation (LoRA) variants.

Text-to-image generation with control plugins running on-device.

Background

With diffusion models, image generation is modeled as an iterative denoising process. Starting from a noise image, at each step, the diffusion model gradually denoises the image to reveal an image of the target concept. Research shows that leveraging language understanding via text prompts can greatly improve image generation. For text-to-image generation, the text embedding is connected to the model via cross-attention layers. Yet, some information is difficult to describe by text prompts, e.g., the position and pose of an object. To address this problem, researchers add additional models into the diffusion to inject control information from a condition image.

Common approaches for controlled text-to-image generation include Plug-and-Play, ControlNet, and T2I Adapter. Plug-and-Play applies a widely used denoising diffusion implicit model (DDIM) inversion approach that reverses the generation process starting from an input image to derive an initial noise input, and then employs a copy of the diffusion model (860M parameters for Stable Diffusion 1.5) to encode the condition from an input image. Plug-and-Play extracts spatial features with self-attention from the copied diffusion, and injects them into the text-to-image diffusion. ControlNet creates a trainable copy of the encoder of a diffusion model, which connects via a convolution layer with zero-initialized parameters to encode conditioning information that is conveyed to the decoder layers. However, as a result, the size is large, half that of the diffusion model (430M parameters for Stable Diffusion 1.5). T2I Adapter is a smaller network (77M parameters) and achieves similar effects in controllable generation. T2I Adapter only takes the condition image as input, and its output is shared across all diffusion iterations. Yet, the adapter model is not designed for portable devices.

The MediaPipe diffusion plugins

To make conditioned generation efficient, customizable, and scalable, we design the MediaPipe diffusion plugin as a separate network that is:

  • Plugable: It can be easily connected to a pre-trained base model.
  • Trained from scratch: It does not use pre-trained weights from the base model.
  • Portable: It runs outside the base model on mobile devices, with negligible cost compared to the base model inference.
Method    Parameter Size     Plugable     From Scratch     Portable
Plug-and-Play    860M*     ✔️        
ControlNet    430M*     ✔️        
T2I Adapter    77M     ✔️     ✔️    
MediaPipe Plugin    6M     ✔️     ✔️     ✔️
Comparison of Plug-and-Play, ControlNet, T2I Adapter, and the MediaPipe diffusion plugin.
* The number varies depending on the particulars of the diffusion model.

The MediaPipe diffusion plugin is a portable on-device model for text-to-image generation. It extracts multiscale features from a conditioning image, which are added to the encoder of a diffusion model at corresponding levels. When connecting to a text-to-image diffusion model, the plugin model can provide an extra conditioning signal to the image generation. We design the plugin network to be a lightweight model with only 6M parameters. It uses depth-wise convolutions and inverted bottlenecks from MobileNetv2 for fast inference on mobile devices.

Overview of the MediaPipe diffusion model plugin. The plugin is a separate network, whose output can be plugged into a pre-trained text-to-image generation model. Features extracted by the plugin are applied to the associated downsampling layer of the diffusion model (blue).

Unlike ControlNet, we inject the same control features in all diffusion iterations. That is, we only run the plugin once for one image generation, which saves computation. We illustrate some intermediate results of a diffusion process below. The control is effective at every diffusion step and enables controlled generation even at early steps. More iterations improve the alignment of the image with the text prompt and generate more detail.

Illustration of the generation process using the MediaPipe diffusion plugin.

Examples

In this work, we developed plugins for a diffusion-based text-to-image generation model with MediaPipe Face Landmark, MediaPipe Holistic Landmark, depth maps, and Canny edge. For each task, we select about 100K images from a web-scale image-text dataset, and compute control signals using corresponding MediaPipe solutions. We use refined captions from PaLI for training the plugins.

Face Landmark

The MediaPipe Face Landmarker task computes 478 landmarks (with attention) of a human face. We use the drawing utils in MediaPipe to render a face, including face contour, mouth, eyes, eyebrows, and irises, with different colors. The following table shows randomly generated samples by conditioning on face mesh and prompts. As a comparison, both ControlNet and Plugin can control text-to-image generation with given conditions.

Face-landmark plugin for text-to-image generation, compared with ControlNet.

Holistic Landmark

MediaPipe Holistic Landmarker task includes landmarks of body pose, hands, and face mesh. Below, we generate various stylized images by conditioning on the holistic features.

Holistic-landmark plugin for text-to-image generation.

Depth

Depth-plugin for text-to-image generation.

Canny Edge

Canny-edge plugin for text-to-image generation.

Evaluation

We conduct a quantitative study of the face landmark plugin to demonstrate the model’s performance. The evaluation dataset contains 5K human images. We compare the generation quality as measured by the widely used metrics, Fréchet Inception Distance (FID) and CLIP scores. The base model is a pre-trained text-to-image diffusion model. We use Stable Diffusion v1.5 here.

As shown in the following table, both ControlNet and the MediaPipe diffusion plugin produce much better sample quality than the base model, in terms of FID and CLIP scores. Unlike ControlNet, which needs to run at every diffusion step, the MediaPipe plugin only runs once for each image generated. We measured the performance of the three models on a server machine (with Nvidia V100 GPU) and a mobile phone (Galaxy S23). On the server, we run all three models with 50 diffusion steps, and on mobile, we run 20 diffusion steps using the MediaPipe image generation app. Compared with ControlNet, the MediaPipe plugin shows a clear advantage in inference efficiency while preserving the sample quality.

Model     FID↓     CLIP↑     Inference Time (s)
Nvidia V100     Galaxy S23
Base     10.32     0.26     5.0     11.5
Base + ControlNet     6.51     0.31     7.4 (+48%)     18.2 (+58.3%)
Base + MediaPipe Plugin     6.50     0.30     5.0 (+0.2%)     11.8 (+2.6%)
Quantitative comparison on FID, CLIP, and inference time.

We test the performance of the plugin on a wide range of mobile devices from mid-tier to high-end. We list the results on some representative devices in the following table, covering both Android and iOS.

Device     Android     iOS
    Pixel 4     Pixel 6     Pixel 7     Galaxy S23     iPhone 12 Pro     iPhone 13 Pro
Time (ms)     128     68     50     48     73     63
Inference time (ms) of the plugin on different mobile devices.

Conclusion

In this work, we present MediaPipe, a portable plugin for conditioned text-to-image generation. It injects features extracted from a condition image to a diffusion model, and consequently controls the image generation. Portable plugins can be connected to pre-trained diffusion models running on servers or devices. By running text-to-image generation and plugins fully on-device, we enable more flexible applications of generative AI.

Acknowledgments

We’d like to thank all team members who contributed to this work: Raman Sarokin and Juhyun Lee for the GPU inference solution; Khanh LeViet, Chuo-Ling Chang, Andrei Kulik, and Matthias Grundmann for leadership. Special thanks to Jiuqiang Tang, Joe Zou and Lu wang, who made this technology and all the demos running on-device.

Categories
Misc

Debugging CUDA More Efficiently with NVIDIA Compute Sanitizer

Stylized image of a beetle on lines of code.Debugging code is a crucial aspect of software development but can be both challenging and time-consuming. Parallel programming with thousands of threads can…Stylized image of a beetle on lines of code.

Debugging code is a crucial aspect of software development but can be both challenging and time-consuming. Parallel programming with thousands of threads can introduce new dimensions to the already complex debugging process.

There are various tools and techniques available to developers to help make debugging simpler and more efficient. This post looks at one such suite of debugging tools: NVIDIA Compute Sanitizer. We explore the features and walk you through examples that show its use, so that you can save time and effort in the debugging process while improving the reliability and performance of your CUDA applications.

Compute Sanitizer is bundled in the CUDA Toolkit.

What is Compute Sanitizer?

Compute Sanitizer is a suite of tools that can perform different types of checks on the functional correctness of your code. A key debugging challenge is finding the bug’s root cause. Resolving it is usually easier than tracking it down. This is especially true in parallel execution environments where the source of a bug can be transient.

Compute Sanitizer excels at root-cause debugging by checking your code for memory access violations, race conditions, access to uninitialized variables, and synchronization errors. All these could manifest as bugs but with behavior that would not necessarily lead directly to the root cause in the source code.

You may already be familiar with one tool for debugging: cuda-memcheck. This tool was deprecated in CUDA 11.6 and has been removed in CUDA 12.0 and later. Compute Sanitizer takes its place, with additional capabilities such as improved performance and support for Microsoft hardware-accelerated GPU scheduling, as well as much broader support for features beyond memory checking.

There are four main tools in Compute Sanitizer:

  • memcheck: For memory access error and leak detection
  • racecheck: Shared memory data access hazard detection tool
  • initcheck: Uninitialized device global memory access detection tool
  • synccheck: For thread synchronization hazard detection

As well as these tools, Compute Sanitizer has some additional capabilities:

Getting started with Compute Sanitizer

Compute Sanitizer is available for free as part of the CUDA Toolkit. For more information and a link to download the toolkit, see NVIDIA Compute Sanitizer.

When you have the toolkit installed, launch Compute Sanitizer from the command line, using the following format:

$ compute-sanitizer [options] app_name [app_options]

Table 1 shows a selection of the Compute Sanitizer options. For more information, see Command-Line Options in the Compute Sanitizer User Manual.

Option Description
--kernel-regex kns=myKernelSubstring Controls which kernels are checked by Compute Sanitizer tools. Useful for large, complex code to manage testing and tool output.
–-launch-skip N Skips N kernel launches before beginning checking.
–-log-file filename Sets a file that Compute Sanitizer writes to. Normally, Compute Sanitizer writes directly to stdout.
--generate-coredump yes Creates a CUDA coredump when an error is detected, which can be loaded up later into the CUDA debugger cuda-gdb for further analysis.
Table 1. Some options for the Compute Sanitizer command-line interface

Compiling for Compute Sanitizer

Compute Sanitizer can successfully analyze and check GPU applications without any special compilation flags. However, the output of the tools can be made more useful by including some extra flags at the compilation stage of your code, such as -lineinfo to generate line number information without impacting your code on an optimization level. Then Compute Sanitizer can attribute errors to lines of source code.

Compute Sanitizer memory checking

Perhaps the most used tool in Compute Sanitizer is the memory checker. The following code example shows a simple CUDA program for multiplying each element of an array by a scalar. This code executes to completion without complaint, but can you see anything wrong with it?

#include 
#include 

#define N 1023

__global__ void scaleArray(float* array, float value) {
  int threadGlobalID    = threadIdx.x + blockIdx.x * blockDim.x;
  array[threadGlobalID] = array[threadGlobalID]*value;
  return;
}

int main() {
  float* array;
  cudaMallocManaged(&array, N*sizeof(float)); // Allocate, visible to both CPU and GPU
  for (int i=0; i>>(array, 3.0);
  cudaDeviceSynchronize();

  printf("After : Array 0, 1 .. N-1: %f %f %fn", array[0], array[1], array[N-1]);
  assert(array[N/2] == 3.0); // Check it's worked
  exit(0);
}

Ten points if you spotted the out-of-bounds array access:

  • The execution configuration >> launches 4 blocks with 256 threads in each, so 1,024 threads in total.
  • The array has length N=1023, indexed 0, 1 …, N-2=1021, N-1=1022.
  • At some point, the 1024th thread, which has a threadGlobalID value of 1023 = threadIdx.x + blockIdx.x * blockDim.x = 255+3*256, attempts to execute the code.
  • An out-of-bounds array access is attempted as array[1023].

This leads to a pesky bug: “undefined behavior.” It may well fail silently. In a larger program, it could cause severe correctness issues impacting other memory allocations or may even cause segmentation faults.

Try compiling and running the code:

$ nvcc -lineinfo example1.cu -o example1.exe
$ ./example1.exe
Before: Array 0, 1 .. N-1: 1.000000 1.000000 1.000000
After : Array 0, 1 .. N-1: 3.000000 3.000000 3.000000

Bring in Compute Sanitizer to assist. Try running the following command and you should see a similar output:

$ compute-sanitizer --tool memcheck ./example1.exe

========= COMPUTE-SANITIZER
Before: Array 0, 1 .. N-1: 1.000000 1.000000 1.000000
========= Invalid __global__ read of size 4 bytes
=========     at 0x70 in /home/pgraham/devblog/NCS/example1.cu:8:scaleArray(float *, float)
=========     by thread (255,0,0) in block (3,0,0)
=========     Address 0x7f3aae000ffc is out of bounds
=========     and is 1 bytes after the nearest allocation at 0x7f3aae000000 of size 4092 bytes
...

For more information about how to interpret this output, see Understanding Memcheck Errors but we can discuss some of the key features. First, you get the error info Invalid __global__ read because the GPU is trying to read some global memory that is not a legitimate address. Then, you get the file and line number and the actual thread and block that caused this. In this case, example1.cu:8 maps to the line array[threadGlobalID] = array[threadGlobalID]*value; in the source.

Now you can fix the code. There are various options to do this but adding if threadGlobalID before the erroneous line is probably easiest. Recompile and run the memcheck tool again to confirm.

Now, did you spot anything else wrong?

20 points if you spotted the lack of cudaFree for the MallocManaged array at the end of the code. Again, the code runs to completion. You appear to get the right answer, but in not freeing allocated memory, you’ve introduced a leak! This could reduce the amount of memory available to subsequent applications or even lead to system instability.

The vanilla run of memcheck missed this. How can you check for these errors? One of the additional options for the memcheck tool can help you here: --leak-check=full.

$ compute-sanitizer --tool memcheck --leak-check=full ./example1.exe

========= COMPUTE-SANITIZER
Before: Array 0, 1 .. N-1: 1.000000 1.000000 1.000000
After : Array 0, 1 .. N-1: 3.000000 3.000000 3.000000
========= Leaked 4092 bytes at 0x7ff652000000
=========     Saved host backtrace up to driver entry point at allocation time
=========     Host Frame: [0x2b7e93]
=========                in /usr/lib/x86_64-linux-gnu/libcuda.so.1
=========     Host Frame:__cudart585 [0x439a0]
=========                in /home/pgraham/devblog/NCS/./example1.exe
=========     Host Frame:__cudart836 [0x10c76]
=========                in /home/pgraham/devblog/NCS/./example1.exe
=========     Host Frame:cudaMallocManaged [0x51483]
=========                in /home/pgraham/devblog/NCS/./example1.exe
=========     Host Frame:cudaError cudaMallocManaged(float**, unsigned long, unsigned int) [0xb066]
=========                in /home/pgraham/devblog/NCS/./example1.exe
=========     Host Frame:main [0xac2e]
=========                in /home/pgraham/devblog/NCS/./example1.exe
=========     Host Frame:__libc_start_main [0x24083]
=========                in /usr/lib/x86_64-linux-gnu/libc.so.6
=========     Host Frame:_start [0xab0e]
=========                in /home/pgraham/devblog/NCS/./example1.exe
=========
========= LEAK SUMMARY: 4092 bytes leaked in 1 allocations
========= ERROR SUMMARY: 1 error

You should see output like that shown in the code example. cudaError is highlighted, which shows that your call to cudaMallocManaged created the memory that leaked. The allocated memory was not freed before the code exited. Adding cudaFree(array); at the end just before exit(0); fixes that. Do that, recompile, execute, and check that you (and the memcheck tool) are now happy with your code.

This is a simple program to scale an array on the GPU, used to show how Compute Sanitizer and memcheck work. When accessing arrays in CUDA, use a grid-stride loop to write code for arbitrarily sized arrays. For more information about error-checking code around calls to the CUDA API, see How to Query Device Properties and Handle Errors in CUDA C/C++.

What is a data race?

Data races are an issue particular to parallel programming approaches. They occur when multiple threads access shared data concurrently, and at least one of the accesses is a write operation. Figure 1 shows a simple example.

Diagram shows threads A and B performing overlapping operations on values in shared memory so the local values are different and there is a question mark on the final shared value depending on when operations complete.
Figure 1. Data race example of parallel threads with overlapping operations

Storage declared with the __shared__ qualifier is placed in on-chip shared memory. All threads within the same thread block can access this per-block shared memory, at much faster speeds compared to global memory access. Shared memory is frequently used for inter-thread communication and as a temporary buffer to hold data being processed.

Consider Thread A and Thread B working in parallel and contributing their local tally to a shared counter. The threads add their own local value to the shared value and write their sum back to shared memory simultaneously. As A and B are now writing different values to the same address, a data race occurs and the result is suddenly incorrect, potentially even undefined.

There are mechanisms to avoid this situation. For example, locks and atomic operations help ensure correct behavior by protecting updates to shared values. However, we are all fallible. In complex code with thousands of threads, it may be ambiguous whether there is even an issue. The shared value may well still increase, just not in the manner data values would suggest, yielding what appears to be a successful run with incorrect values.

This is where the Compute Sanitizer racecheck feature is so valuable. This tool is a race condition detection feature that helps you identify and resolve data races in your CUDA code.

The following code example shows the GPU kernel used to demonstrate racecheck:

#include 
#include 

#define N 1024

__global__ void blockReduceArray(int* array, int* sum) {
  int threadGlobalID = threadIdx.x + blockIdx.x * blockDim.x;
  __shared__ int blockSum;

  if (threadIdx.x  == 0 ) {
    sum[blockIdx.x] = 0; // Initialise the return value
    blockSum = 0;        // Initialise our block level counter
  }
  __syncthreads();

  // Add each thread's value to our block level total
  blockSum += array[threadGlobalID];
  __syncthreads();

  // Set the return value
  if (threadIdx.x  == 0 ) sum[blockIdx.x] = blockSum; 
  return;
}

int main() {
  int globalSum;
  int* sum;
  int* array;
  int numBlocks = 4;
  cudaMallocManaged(&array, N*sizeof(int));
  cudaMallocManaged(&sum, numBlocks*sizeof(int));
  for (int i=0; i>>(array, sum);
  cudaDeviceSynchronize();

  // Do a reduction on the host of the block values
  globalSum = 0;
  for (int i=0; i

The example adds up all the values in an array to produce a single value, also known as a reduction operation. It sums up at the block level on the GPU. Then, each block’s total is returned to the host and summed again to return the total value of adding every value in the array. This example uses the fast shared memory as a buffer to hold the running total of array element additions.

This approach avoids unnecessary writes to global memory until the final update at the end of the kernel. When introducing such optimizations it’s a good idea to use an analysis-driven method. Profile the code, check for any bottlenecks, underutilized hardware, or algorithms to optimize; apply your changes; and then repeat.

After you’ve familiarized yourself with the code, compile and run it to see if it works. You’re initializing each element of the array to one, and there are 1,024 of them, so the final summation should be 1,024. Here’s the output:

$ nvcc -lineinfo example2.cu -o example2.exe
$ ./example2.exe
$
After kernel - global sum = 4

Another bug: 4 is definitely not 1,024, as you were expecting!

Compute Sanitizer racecheck helps you determine what failed and avoid such a scenario. The racecheck command is executed in a similar manner to memcheck and the following example shows the output from the command. Line number 17 is the problem, as shown in the error message.

$ compute-sanitizer --tool racecheck ./example2.exe

========= COMPUTE-SANITIZER
========= Error: Race reported between Read access at 0xe0 in /home/pgraham/devblog/NCS/example2.cu:17:blockReduceArray(int *, int *)
=========     and Write access at 0x100 in /home/pgraham/devblog/NCS/example2.cu:17:blockReduceArray(int *, int *) [16 hazards]
=========
After kernel - global sum = 4
========= RACECHECK SUMMARY: 1 hazard displayed (1 error, 0 warnings)

If you look at that highlighted line of code, you can see the issue:

  ... 
  // Add each thread's value to the block level total
  blockSum += array[threadGlobalID];
  ...

All the threads in the block are simultaneously trying to read the shared memory value stored as blockSum, add their array value to it, and write it back to the shared memory address. This creates a race condition like the example in Figure 1. As a result, each thread reads the shared value (0), increments it (1), then writes 1 back. Ultimately, the shared value ends up being 1 instead of 256, and when each of those are added together from the four blocks, you see the wrong answer of 4.

You can fix this particular issue for the block reduction code by changing line 17 to use atomicAdd:

atomicAdd(&blockSum, array[threadGlobalID]);

This operation protects access to the shared value blockSum by ensuring that it is read from, incremented, and written out in serial by the accessing threads. The code now runs correctly.

By the way, the use of atomicAdd in the fix may introduce a slowdown in the code performance. For instance, it is potentially serializing all 256 threads per block. NVIDIA CUB is a reusable software components repository that has both block-level and device-level primitives for performing highly optimized reductions.

Where possible, we recommend using libraries or components such as CUB, when developing and performance-tuning common code patterns, as they often trump the performance of what you could implement in a reasonable time. And they are usually bug-free!

If it was not such straightforward code where you knew the expected answer, something like this race condition could easily be left undiscovered. So, racecheck has helped avoid hard-to-decipher problems further down the line.

Conclusion

Use NVIDIA Compute Sanitizer today by downloading the CUDA Toolkit.

Hopefully, we have given you an idea of how to get started with Compute Sanitizer. Of course, the tools are feature-rich and we have only skimmed the surface. For more information and examples of using Compute Sanitizer, see the /NVIDIA/compute-sanitizer-samples GitHub samples repo and the Compute Sanitizer User Manual.

These recent GTC sessions cover some of the newer features introduced in Compute Sanitizer:

For support, the Developer Forum, and the subforum dedicated to the sanitizer tools are great places to start.

Let us know if you would like a deeper dive on any of the features not discussed in this post. Good luck with your bug hunt!

Categories
Misc

New Video: Composition and Layering with Universal Scene Description

A man standing in an open office.Developers are using Universal Scene Description (OpenUSD) to push the boundaries of 3D workflows. As an ecosystem and interchange paradigm, OpenUSD models,…A man standing in an open office.

Developers are using Universal Scene Description (OpenUSD) to push the boundaries of 3D workflows. As an ecosystem and interchange paradigm, OpenUSD models, labels, classifies, and combines a wide range of data sources into a composed ground truth. It is also highly extensible with four key features that help developers meet the demands of virtual worlds.

In this video series, we’re exploring OpenUSD superpowers and providing you with a foundational understanding to harness them. Our first episode highlighted four key features of OpenUSD that make it the ideal tool for data modeling and interchange.

Our newly released second installment focuses on composition and layering in OpenUSD. In this video, you will learn about:

  • Composed worlds and layer stacks.
  • How sparse, nondestructive overrides work.
  • Variants and variant sets.
  • The power of composition.

Watch the following video to dive in.

Video 1. Learn how the OpenUSD composition engine enables sparse, nondestructive assembly of data from multiple sources

To learn more about the latest advancements in OpenUSD, join us at SIGGRAPH. For the latest resources and tutorials, visit our OpenUSD resources page.

If you’re a developer, get started with Omniverse resources. Stay up to date on the platform by subscribing to the newsletter, and following NVIDIA Omniverse on Instagram, Medium, and Twitter. Check out our forums, Discord server, Twitch, and YouTube channels.

Categories
Misc

What Is Robotics Simulation?

Robots are moving goods in warehouses, packaging foods and helping assemble vehicles  — when they’re not flipping burgers or serving lattes. How did they get so skilled so fast? Robotics simulation. Making leaps in progress, it’s transforming industries all around us. Robotics Simulation Summarized A robotics simulator places a virtual robot in virtual environments to Read article >

Categories
Misc

‘Remnant II’ Headlines 14 Games Joining GeForce NOW in July

It’s a jam-packed July with 14 newly supported titles in the GeForce NOW library, including Remnant II from Gunfire Games and Gearbox Publishing. Need a new adventure? Check out the nine additions streaming from the cloud this week. Plus, the Steam Summer Sale kicks off this week, and many supported titles in the GeForce NOW Read article >

Categories
Misc

Calm, Cool and Creative: MUE Studio Showcases 3D Scenes ‘In the NVIDIA Studio’

MUE Studio, founded by 3D artists Minjin Kang and Mijoo Kim, specializes in art direction, photography and 3D design for campaigns and installations.

Categories
Misc

Matice Founder and Harvard Professor, Jessica Whited on Harnassing Regenerative Species – and AI – for Medical Breakthroughs

Scientists at Matice Biosciences are using AI to study the regeneration of tissues in animals known as super-regenerators, such as salamanders and planarians. The goal of the research is to develop new treatments that will help humans heal from injuries without scarring. On the latest episode of NVIDIA’s AI Podcast, host Noah Kravtiz spoke with Read article >

Categories
Misc

How to Deploy an AI Model in Python with PyTriton

AI models are everywhere, in the form of chatbots, classification and summarization tools, image models for segmentation and detection, recommendation models,…

AI models are everywhere, in the form of chatbots, classification and summarization tools, image models for segmentation and detection, recommendation models, and more. AI machine learning (ML) models help automate many business processes, generate insights from data, and deliver new experiences. 

Python is one of the most popular languages used in AI/ML development. In this post, you will learn how to use NVIDIA Triton Inference Server to serve models within your Python code and environment using the new PyTriton interface

More specifically, you will learn how to prototype and test inference of an AI model in a Python development environment with a production-class tool, and how to go to production with the PyTriton interface. You will also learn the advantages of using PyTriton, compared to a generic web framework like FastAPI or Flask. The post includes several code examples to illustrate how you can activate high-performance batching, preprocessing, and multi-node inference; and implement online learning.

What is PyTriton?

PyTriton is a simple interface that enables Python developers to use Triton Inference Server to serve AI models, simple processing functions, or entire inference pipelines within Python code. Triton Inference Server is an open-source multi-framework inference serving software with high performance on CPUs and GPUs.

PyTriton enables rapid prototyping and testing of ML models while achieving performance and efficiency with, for example, high GPU utilization. A single line of code brings up Triton Inference Server, providing benefits such as dynamic batching, concurrent model execution, and support for GPU and CPU from within the Python code. 

PyTriton removes the need to set up model repositories and port models from the development environment to production. Existing inference pipeline code can also be used without modification. This is especially useful for newer types of frameworks like JAX, or complex pipelines that are part of the application code without dedicated backends in Triton Inference Server.

Simplicity of Flask

Flask and FastAPI are generic Python web frameworks used to deploy a wide variety of Python applications. Because of their simplicity and widespread adoption, many developers use them to deploy and run AI models in production. However, significant drawbacks to this approach include the following:

  • General-purpose web servers lack support for AI inference features. There is no out-of-box support to take advantage of accelerators like GPUs, or to turn on dynamic batching or multi-node inference.
  • Users need to build logic to meet the demands of specific use cases, like audio/video streaming input, stateful processing, or preprocessing the input data to fit the model.
  • Metrics on compute and memory utilization or inference latency are not easily accessible to monitor application performance and scale.

Triton Inference Server includes built-in support for features like those listed above, and many more. PyTriton provides the simplicity of Flask and the benefits of Triton in Python. An example deployment of a HuggingFace text classification pipeline using PyTriton is shown below:

import logging
 
import numpy as np
from transformers import BertTokenizer, FlaxBertModel  # pytype: disable=import-error
 
from pytriton.decorators import batch
from pytriton.model_config import ModelConfig, Tensor
from pytriton.triton import Triton
 
logger = logging.getLogger("examples.huggingface_bert_jax.server")
logging.basicConfig(level=logging.INFO, format="%(asctime)s - %(levelname)s - %(name)s: %(message)s")
 
tokenizer = BertTokenizer.from_pretrained("bert-base-uncased")
model = FlaxBertModel.from_pretrained("bert-base-uncased")
 
 
@batch
def _infer_fn(**inputs: np.ndarray):
	(sequence_batch,) = inputs.values()
 
	# need to convert dtype=object to bytes first
	# end decode unicode bytes
	sequence_batch = np.char.decode(sequence_batch.astype("bytes"), "utf-8")
 
	last_hidden_states = []
	for sequence_item in sequence_batch:
    	tokenized_sequence = tokenizer(sequence_item.item(), return_tensors="jax")
    	results = model(**tokenized_sequence)
    	last_hidden_states.append(results.last_hidden_state)
	last_hidden_states = np.array(last_hidden_states, dtype=np.float32)
	return [last_hidden_states]
 
 
with Triton() as triton:
	logger.info("Loading BERT model.")
	triton.bind(
    	model_name="BERT",
    	infer_func=_infer_fn,
    	inputs=[
        	Tensor(name="sequence", dtype=np.bytes_, shape=(1,)),
    	],
    	outputs=[
        	Tensor(name="last_hidden_state", dtype=np.float32, shape=(-1,)),
    	],

PyTriton offers an interface familiar to Flask users for easy installation and setup, and provides the following benefits: 

  • ​Bring up NVIDIA Triton with a single line of code
  • No need to set up model repositories and model format conversion (important for a high-performance implementation using Triton Inference Server)
  • Use of existing inference pipeline code without modification
  • Support for many decorators to adapt model input  

Whether working on a generative AI application or any other model, PyTriton enables you to gain the benefits of Triton Inference Server in your own development environment. It helps take advantage of the GPU to produce an inference response in very short time (milliseconds or seconds, depending on the use case). It also helps run the GPU at high capacity and serve many inference requests at the same time, keeping ‌infrastructure costs low.

PyTriton code examples

This section provides a few code examples you can use to get started with PyTriton. They begin on a local machine, which is ideal to test and prototype, and provide Kubernetes configuration for scaled deployment. 

Dynamic batching support

A key difference between Flask/FastAPI and PyTriton, dynamic batching enables batching of inference requests from multiple calling applications for the model, while retaining the latency requirements. Two examples are HuggingFace BART PyTorch and HuggingFace ResNET PyTorch.

Online learning

Online learning is learning from new data continuously in production. With PyTriton, you can control the number of distinct model instances backing your inference server. This enables you to train and serve the same model simultaneously from two different endpoints. Learn more about how to use PyTriton to train and infer models at the same time on MNIST dataset.

Multi-node inference of large language models

Large language models (LLMs) that are too large to fit into a single GPU memory require the model to be partitioned across multiple GPUs, and in certain cases across multiple nodes for inference. Check out an example using Hugging Face OPT model in JAX with inference done on multiple nodes. 

See NeMo Megatron GPT model deployment for a second example that uses the NVIDIA NeMo 1.3B parameter model. The multi-node inference deployment orchestration is shown using both Slurm and Kubernetes.

Stable Diffusion

With PyTriton, you can use preprocessing decorators to perform advanced batching operations, like batching together images of the same size using simple definitions:

@batch
@group_by_values("img_size")
@first_value("img_size")

To learn more, check out this example that uses the Stable Diffusion 1.5 image generation pipeline from Hugging Face.

Summary

PyTriton provides a simple interface that enables Python developers to use NVIDIA Triton Inference Server to serve a model, a simple processing function, or an entire inference pipeline. This native support for Triton Inference Server in Python enables rapid prototyping and testing of ML models with performance and efficiency. A single line of code brings up Triton Inference Server. Dynamic batching, concurrent model execution, and support for GPU and CPU from within the Python code are among the benefits. PyTriton offers the simplicity of Flask and the benefits of Triton Inference Server in Python. 

Try PyTriton using the examples in this post, or using your own model. See Migrating to the Triton Inference Server for information on migrating from Flask to PyTriton and Triton Inference Server. To learn more, visit the Triton Inference Server page and PyTriton repository on GitHub.

Categories
Misc

ICYMI: Exploring Challenges Posed by Biased Datasets Using Rapids cuDF

Several graph illustrations representing data science.Read about an innovative GPU solution that solves limitations using small biased datasets with RAPIDS cuDF.Several graph illustrations representing data science.

Read about an innovative GPU solution that solves limitations using small biased datasets with RAPIDS cuDF.