Categories
Misc

Edge AI is Powering a Safer, Smarter World 

NVIDIA is partnering with IronYun to leverage the capabilities of edge AI to help make the world a smarter, safer, more efficient place.

Nearly every organization is enticed by the ability to use cameras to understand their businesses better. Approximately 1 billion video cameras—the ultimate Internet of Things (IoT) sensors—are being used to help people around the world live better and safer. 

But, there is a clear barrier to success. Putting the valuable data collected by these cameras to use requires significant human effort. The time-consuming process of manually reviewing massive amounts of footage is arduous and costly. Moreover, after the review is complete, much of the footage is either thrown out or stowed away in the cloud and never used again. 

This leads to vast amounts of valuable data never being used to its full potential. 

Luckily, thanks to advancements in AI and edge computing, organizations can now layer AI analytics directly onto their existing camera infrastructures to expand the value of video footage captured. By adding intelligence to the equation, organizations can transform physical environments into safer, smarter spaces with AI-powered video analytics systems.

Edge AI in action

This change is already helping companies in many industries improve customer experiences, enhance safety, drive accountability, and deliver operational efficiency. The possibilities for expanding these smart spaces and reaping even greater benefits are vast. 

In the retail space, an AI-powered smart store can elevate the consumer shopping experience by using heat maps to improve customer traffic flow, accurately forecast product demand, and optimize supply chain logistics. Ultimately, these smart stores could completely transform retail as we know it and use cameras to create “just walk out” shopping experiences, with no cash registers required. 

At electrical substations, intelligent video analytics is streamlining asset inspection and ensuring site safety and security. AI-powered analysis of real-time video streaming provides continuous monitoring of substation perimeters. This can be used to prevent unauthorized access, ensure technicians and engineers follow health and safety protocols, and detect dangerous environmental conditions like smoke and fire.

Creating a smart space 

At the forefront of this smart space revolution is the AI vision company and NVIDIA Metropolis partner IronYun. The IronYun AI platform, Vaidio, is helping retailers, banks, NFL stadiums, factories, and more fuel their existing cameras with the power of AI. 

NVIDIA and IronYun are working to leverage the capabilities of edge AI and help make the world a smarter, safer, more efficient place.

A smart space is more than simply a physical location equipped with cameras. To be truly smart, these spaces must take collected data to generate critical insights that create superior experiences.

According to IronYun, most organizations today use cameras to improve safety in their operations. The IronYun Vaidio platform extends beyond basic security applications and supports dozens of advanced AI-powered video analytics capabilities specific to each customer. From video search to heat map creation and detection for PPE, IronYun is helping organizations across all industries take their business to the next level with AI through a single platform.

How does this look in the real world? An NFL stadium that hosts 65,000 fans at every game uses Vaidio in interesting ways. The customer first approached IronYun in hopes of improving safety and security operations at the stadium. Once they saw Vaidio analytics in action, they realized they could leverage the same advanced platform to monitor and alert security of smoke, fire, falls, and fights, as well as detect crowd patterns. 

IronYun CEO, Paul Sun says, “The tedious task of combing through hours of video footage can take days or weeks to complete. Using Vaidio’s AI video analytics, that same forensic video search can be done in seconds.” 

Powering smart spaces across the world 

Edge AI is the technology that is making smart spaces possible for organizations to mobilize data being produced at the edge. 

The edge is simply a location, named for the way AI computation is done near or at the edge of a network rather than centrally in a cloud computing facility or private data center. Without the low latency and speed provided by the edge, many security and data gathering applications would not be effective or possible. 

Sun says, “When you are talking about use cases to ensure safety like weapons detection or smoke and fire detection, instantaneous processing at the edge can accelerate alert and response times, especially relative to camera-based alternatives.” 

Building the future 

With the powerful capabilities of NVIDIA Metropolis, NVIDIA Fleet Command, and NVIDIA Certified-Systems IronYun applies AI analytics to help make the world safer and smarter, 

The NVIDIA Metropolis platform offers IronYun the development tools and services to reduce the time and cost of developing their vision AI deployments. This is a key factor in their ability to bring multiple new and accurate AI-powered video analytics to the Vaidio platform every year.

Image shows how NVIDIA Fleet Command is a cloud product that can help IT administrators remotely manage many edge sites across all and all industries.
Figure 1. With NVIDIA Fleet command IT admins can remotely manage edge systems across distributed edge sites

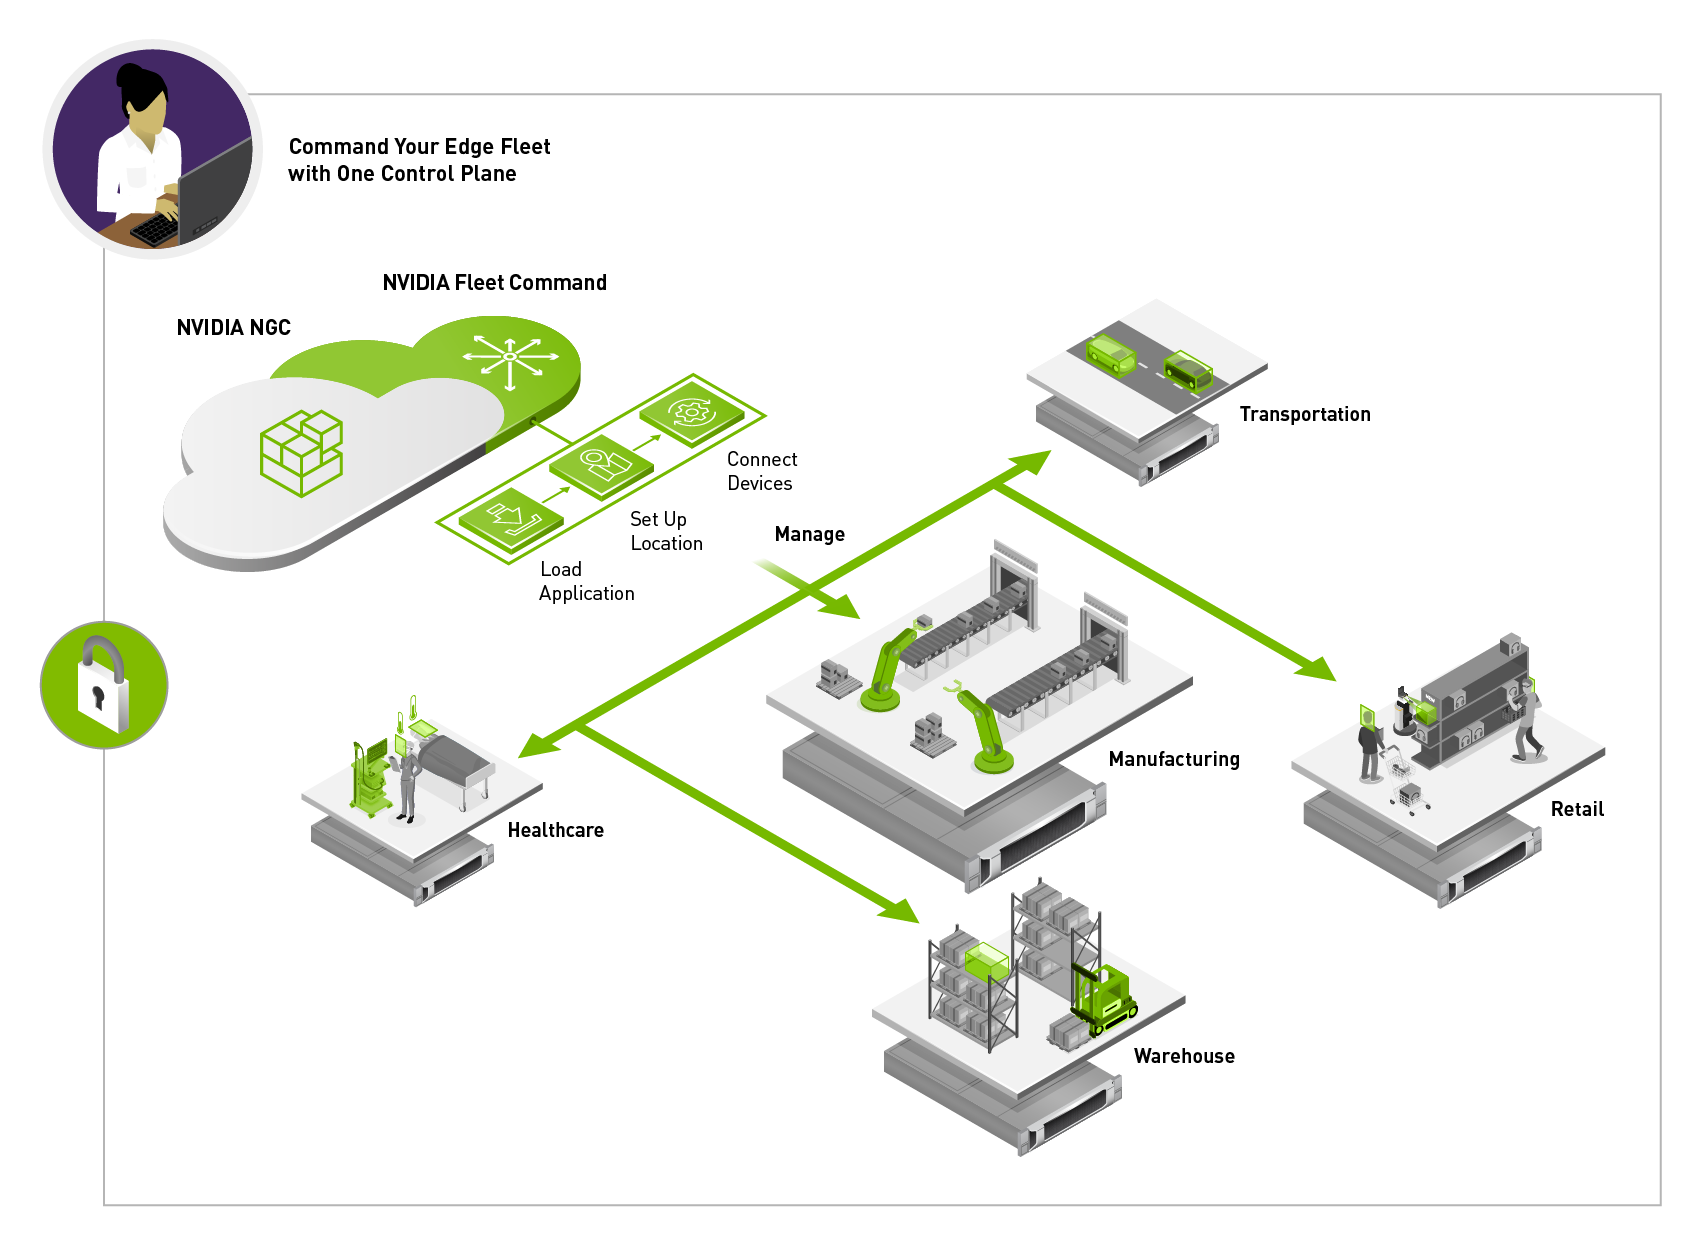
NVIDIA Fleet Command is also an essential component of the Vaidio platform, equipping IT administrators with secure, remote access to all of their systems

Fleet Command eliminates the need for IT teams to be on call 24/7 when a system experiences a bug or issue. Instead, they can troubleshoot and manage emergencies from the comfort of their office. 

The Fleet Command dashboard sits in the cloud and provides administrators a control plane to deploy applications, alerts and analytics. It also provides provisioning and monitoring capabilities, user management control, and other features needed for day-to-day management of the lifecycle of an AI application. 

The dashboard also has a private registry where organizations can securely store their own custom application or a partner application, such as IronYun’s Vaidio platform for deployment at any location.

“With NVIDIA Fleet Command, we are able to scale our vision applications from one or two cameras in a POC, to thousands of cameras in a production deployment. By simplifying the management of edge environments, and improving video analytics accuracy at scale, our customer environments indeed become safer and smarter,” says Sun. 

Explore the countless possibilities this new generation of AI applications is powering, from operational efficiency to safety for city streets, airports, factory floors, and more.

Categories
Misc

Computer Graphics Artist Xueguo Yang Shares Fractal Art Series This Week ‘In the NVIDIA Studio’

Putting art, mathematics and computers together in the mid-1980s created a new genre of digital media: fractal art. In the NVIDIA Studio this week, computer graphics (CG) artist, educator and curator Xueguo Yang shares his insights behind fractal art — which uses algorithms to artistically represent calculations derived from geometric objects as digital images and animations.

The post Computer Graphics Artist Xueguo Yang Shares Fractal Art Series This Week ‘In the NVIDIA Studio’ appeared first on NVIDIA Blog.

Categories
Offsites

How to lie using visual proofs

Categories
Misc

This feature requires paid plan. Please contact the owner.

Feedspot paid plan is required to export Combined RSS feeds. If you are the owner of this feed, please login to your Feedspot account to see upgrade options. In case of any questions feel free to reach us at team@feedspot.com.

Categories
Offsites

This feature requires paid plan. Please contact the owner.

Feedspot paid plan is required to export Combined RSS feeds. If you are the owner of this feed, please login to your Feedspot account to see upgrade options. In case of any questions feel free to reach us at team@feedspot.com.

Categories
Misc

How to interpret the output of get_weights for Keras LSTM?

Can someone please help with this – https://stackoverflow.com/questions/72809662/how-to-interpret-the-output-of-get-weights-for-keras-lstm? It’ll be much appreciated.

submitted by /u/Academic-Rent7800
[visit reddit] [comments]

Categories
Misc

Speed Up Machine Learning Models with Accelerated WEKA

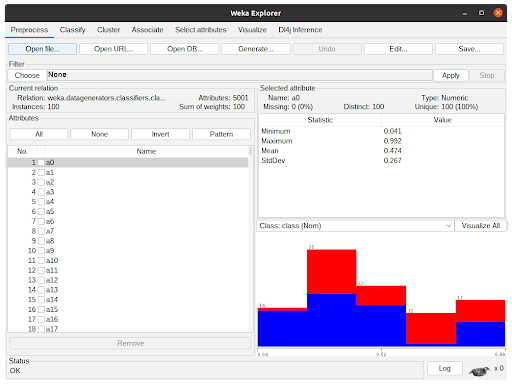
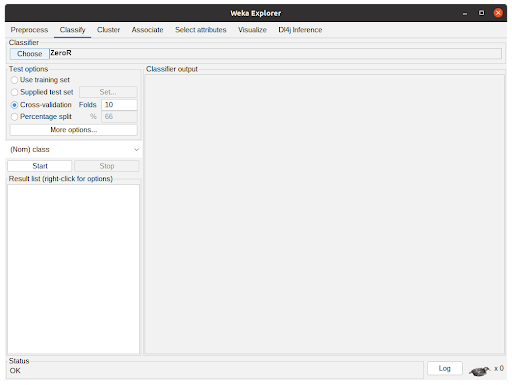
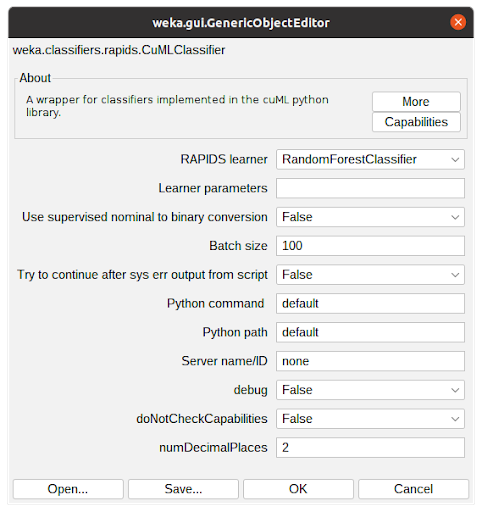
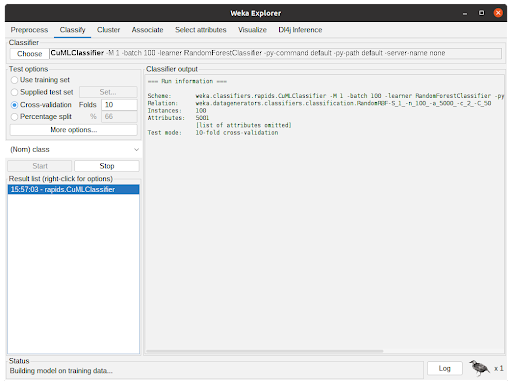
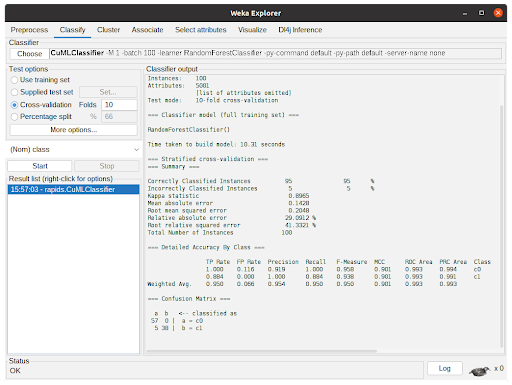
Accelerated WEKA integrates the WEKA workbench with Python and Java libraries that support GPU to speedup the training and prediction time of machine learning models.

In recent years, there has been a surge in building and adopting machine learning (ML) tools. The use of GPUs to accelerate increasingly compute-intensive models has been a prominent trend.

To increase user access, the Accelerated WEKA project provides an accessible entry point for using GPUs in well-known WEKA algorithms by integrating open-source RAPIDS libraries.

In this post, you will be introduced to Accelerated WEKA and learn how to leverage GPU-accelerated algorithms with a graphical user interface (GUI) using WEKA software. This Java open-source alternative is suitable for beginners looking for a variety of ML algorithms from different environments or packages.

What is Accelerated WEKA?

Accelerated WEKA unifies the WEKA software, a well-known and open-source Java software, with new technologies that leverage the GPU to shorten the execution time of ML algorithms. It has two benefits aimed at users without expertise in system configuration and coding: an easy installation and a GUI that guides the configuration and execution of the ML tasks.

Accelerated WEKA is a collection of packages available for WEKA, and it can be extended to support new tools and algorithms.

What is RAPIDS?

RAPIDS  is a collection of open-source Python libraries for users to develop and deploy data science workloads on NVIDIA GPUs.  Popular libraries include cuDF for GPU-accelerated DataFrame processing and cuML for GPU-accelerated machine learning algorithms.  RAPIDS APIs conform as much as possible to the CPU counterparts, such as pandas and scikit-learn.

Accelerated WEKA architecture

The building blocks of Accelerated WEKA are packages like WekaDeeplearning4j and wekaRAPIDS (inspired by wekaPython). WekaDeeplearning4j (WDL4J) already supports GPU processing but has very specific needs in terms of libraries and environment configuration. WDL4J provides WEKA wrappers for the Deeplearning4j library.

For Python users wekaPython initially provided Python integration by creating a server and communicating with it through sockets. With this the user can execute scikit-learn ML algorithms (or even XGBoost) inside the WEKA workbench. Furthermore, wekaRAPIDS provides integration with RAPIDS cuML library by using the same technique in wekaPython.

Together, both packages provide enhanced functionality and performance inside the user-friendly WEKA workbench. Accelerated WEKA goes a step further in the direction of performance by improving the communication between the JVM and Python interpreter. It does so by using alternatives like Apache Arrow and GPU memory sharing for efficient data transfer between the two languages.

Accelerated WEKA also provides integration with the RAPIDS cuML library, which implements machine learning algorithms that are accelerated on NVIDIA GPUs. Some cuML algorithms can even support multi-GPU solutions.

Supported algorithms

The algorithms currently supported by Accelerated WEKA are:

  • LinearRegression
  • LogisticRegression
  • Ridge
  • Lasso
  • ElasticNet
  • MBSGDClassifier
  • MBSGDRegressor
  • MultinomialNB
  • BernoulliNB
  • GaussianNB
  • RandomForestClassifier
  • RandomForestRegressor
  • SVC
  • SVR
  • LinearSVC
  • KNeighborsRegressor
  • KNeighborsClassifier

The algorithms supported by Accelerated WEKA in multi-GPU mode are:

  • KNeighborsRegressor
  • KNeighborsClassifier
  • LinearRegression
  • Ridge
  • Lasso
  • ElasticNet
  • MultinomialNB
  • CD

Using Accelerated WEKA GUI 

During the Accelerated WEKA design stage, one main goal was for it to be easy to use. The following steps outline how to set it up on a system along with a brief example. 

Please refer to the documentation for more information, and a comprehensive getting started. The only prerequisite for Accelerated WEKA is having Conda installed in your system.

  • The installation of Accelerated WEKA is available through Conda, a system providing package and environment management. Such capability means that a simple command can install all dependencies for the project. For example, on a Linux machine, issue the following command in a terminal for installing Accelerated WEKA and all dependencies.

conda create -n accelweka -c rapidsai -c nvidia -c conda-forge  -c waikato weka

  • After Conda has created the environment, activate it with the following command:

conda activate accelweka

  • This terminal instance just loaded all dependencies for Accelerated WEKA. Launch WEKA GUI Chooser with the command:

weka

  • Figure 1 shows the WEKA GUI Chooser window. From there, click the Explorer button to access the functionalities of Accelerated WEKA.
 Screenshot of Weka GUI Chooser upon starting WEKA application.
Figure 1. WEKA GUI Chooser window. This is the first window that appears when you start WEKA
  • In the WEKA Explorer window (Figure 2), click the Open file button to select a dataset file. WEKA works with ARFF files but can read from CSVs. Converting from CSVs can be pretty straightforward or require some configuration by the user, depending on the types of the attributes.
Screenshot of the WEKA Explorer window showing the Open file button.
Figure 2. In the WEKA Explorer window users can import datasets, check statistics about the attributes, and apply filters to the dataset as preprocessing
  • The WEKA Explorer window with a dataset loaded is shown in Figure 3. Assuming one does not want to preprocess the data, clicking the Classify tab will present the classification options to the user. 
 Screenshot of WEKA Explorer with a dataset loaded in the memory.
Figure 3. WEKA Explorer window with a dataset loaded. After loading the dataset (either from an ARFF file or a CSV file) the attribute names appear on the left. Information regarding the selected attribute appears in the upper right. A chart containing the distribution of the class according to the selected attribute is viewable in the lower right

The Classify tab is presented in Figure 4. Clicking “Choose” button will show the implemented classifiers. Some might be disabled because of the dataset characteristics. To use Accelerated WEKA, the user must select rapids.CuMLClassifier. After that, clicking the bold CuMLClassifier will take the user to the option windows for the classifier.

 Screenshot of the WEKA Classify tab for the user to configure the Classifiers and their options as well as the testing of the built models.
Figure 4. In the WEKA Classify tab, the user can configure the classification algorithm and the test options that are going to be used in the experiment using the previously selected dataset
  • Figure 5 shows the Option window for CuMLClassifier. With the field RAPIDS learner, the user can choose the desired classifier among the ones supported by the package. The field Learner parameters are for the modification of the cuML parameters, details of which can be found in the cuML documentation

The other options are for the user to fine-tune the attribute conversion, configure which python environment is to be used, and determine the number of decimal places the algorithm should operate. For the sake of this tutorial, select Random Forest Classifier and keep everything with the default configuration. Clicking OK will close the window and return to the previous tab.

Screenshot of the classifier configuration window in WEKA showing the options for the CuMLClassifier integration with RandomForestClassifier selected.
Figure 5. With the WEKA Classifier configuration window, the user can configure the parameters of the selected classifier. In this case, it is showing the newly integrated CuMLClassifier options with the RandomForestClassifier learner selected
  • After configuring the Classifier according to the previous step, the parameters will be shown in the text field beside the Choose button. After clicking Start, WEKA will start executing the chosen classifier with the dataset. 

Figure 6 shows the classifier in action. The Classifier output is showing debug and general information regarding the experiment, such as parameters, classifiers, dataset, and test options. The status shows the current state of the execution and the Weka bird on the bottom animates and flips from one side to the other while the experiment is running.

Screenshot of WEKA Classify tab with Random Forest Classifier running. The output shows information about the classifier being used.
Figure 6. WEKA Classify tab with the chosen classification algorithm in progress
  • After the algorithm finishes the task, it will output the summary of the execution with information regarding predictive performance and the time taken. In Figure 7, the output shows the results for 10-fold cross-validation using the RandomForestClassifier from cuML through CuMLClassifier.
 Screenshot of the Classify tab after completing the execution of Random Forest Classifier.
Figure 7. WEKA Classify tab after the experiment has been completed

Benchmarking Accelerated WEKA

We evaluated the performance of Accelerated WEKA, comparing the execution time of the algorithms on the CPU with the execution time using the Accelerated WEKA. The hardware used in the experiments was an i7-6700K, a GTX 1080Ti, and a DGX Station with four A100 GPUs. Unless stated otherwise, the benchmarks use a single GPU.

We used datasets with different characteristics for the benchmarks. Some of them were synthetic for better control of the attributes and instances, like the RDG and RBF generators. The RDG generator builds instances based on decision lists. The default configuration has 10 attributes, 2 classes, a minimum rule size of 1, and a maximum rule size of 10. We changed the minimum and maximum limits to 5 and 20, respectively. With this generator, we created datasets with 1, 2, 5, and 10 million instances, as well as 5 million instances with 20 attributes.

The RBFgenerator creates a random set of centers for each class and then generates instances by getting random offsets from the centers for the attribute values. The number of attributes is indicated with the suffix a__ (for example, a5k means 5 thousand attributes), and the number of instances is indicated by the suffix n__ (for example, n10k means 10 thousand instances). 

Lastly, we used the HIGGS dataset, which contains data about the kinematic properties of the atom accelerator. The first 5 million instances of the HIGGS dataset were used to create HIGGS_5m.

The results for the wekaRAPIDS integration are shown, where we make a direct comparison between the baseline CPU execution with the Accelerated WEKA execution. The results for the WDL4J are shown in Table 5.

XGBoost (CV) i7-6700K GTX 1080Ti Speedup
dataset Baseline (seconds) AWEKA SGM (seconds)
RDG1_1m 266.59 65.77 4.05
RDG1_2m 554.34 122.75 4.52
RDG1_5m 1423.34 294.40 4.83
RDG1_10m 2795.28 596.74 4.68
RDG1_5m_20a 2664.39 403.39 6.60
RBFa5k 17.16 15.75 1.09
RBFa5kn1k 110.14 25.43 4.33
RBFa5kn5k 397.83 49.38 8.06
Table 1. Execution time of experiments with XGBoost using cross-validation comparing the baseline CPU execution time with the Accelerated WEKA execution time while sharing GPU memory on a GTX 1080Ti GPU
XGBoost (no-CV) i7-6700K GTX 1080Ti Speedup A100 Speedup
dataset Baseline (seconds) AWEKA CSV (seconds) AWEKA CSV (seconds)
RDG1_1m 46.40 21.19 2.19 22.69 2.04
RDG1_2m 92.87 34.76 2.67 35.42 2.62
RDG1_5m 229.38 73.49 3.12 65.16 3.52
RDG1_10m 461.83 143.08 3.23 106.00 4.36
RDG1_5m_20a 268.98 73.31 3.67
RBFa5k 5.76 7.73 0.75 8.68 0.66
RBFa5kn1k 23.59 13.38 1.76 19.84 1.19
RBFa5kn5k 78.68 34.61 2.27 29.84 2.64
HIGGS_5m 214.77 169.48 1.27 76.82 2.80
Table 2. Execution time of experiments with XGBoost without using cross-validation. A comparison of the baseline CPU execution time with the Accelerated WEKA execution time while sending a CSV file through sockets on a GTX 1080Ti GPU. Loading times of the dataset were taken out
RandomForest (CV) i7-6700K GTX 1080Ti Speedup
dataset Baseline (seconds) AWEKA SGM (seconds)
RDG1_1m 494.27 97.55 5.07
RDG1_2m 1139.86 200.93 5.67
RDG1_5m 3216.40 511.08 6.29
RDG1_10m 6990.00 1049.13 6.66
RDG1_5m_20a 5375.00 825.89 6.51
RBFa5k 13.09 29.61 0.44
RBFa5kn1k 42.33 49.57 0.85
RBFa5kn5k 189.46 137.16 1.38
Table 3. Execution time of experiments with Random Forest using cross-validation comparing the baseline CPU execution time with the Accelerated WEKA execution time while sharing GPU memory on a GTX 1080Ti GPU
KNN (no-CV) AMD EPYC 7742 (4 cores) NVIDIA A100 Speedup 4X NVIDIA A100 Speedup
dataset Baseline (seconds) wekaRAPIDS (seconds) wekaRAPIDS (seconds)
covertype 3755.80 67.05 56.01 42.42 88.54
RBFa5kn5k 6.58 59.94 0.11 56.21 0.12
RBFa5kn10k 11.54 62.98 0.18 59.82 0.19
RBFa500n10k 2.40 44.43 0.05 39.80 0.06
RBFa500n100k 182.97 65.36 2.80 45.97 3.98
RBFa50n10k 2.31 42.24 0.05 37.33 0.06
RBFa50n100k 177.34 43.37 4.09 37.94 4.67
RBFa50n1m 21021.74 77.33 271.84 46.00 456.99
Table 4. Execution time of experiments with KNN without using cross-validation comparing the baseline CPU execution time with the Accelerated WEKA execution on an NVIDIA A100 GPU
3,230,621 params Neural Network i7-6700K GTX 1080Ti Speedup
Epochs Baseline (seconds) WDL4J (seconds)
50 1235.50 72.56 17.03
100 2775.15 139.86 19.84
250 7224.00 343.14 21.64
500 15375.00 673.48 22.83
Table 5. Execution time of experiments with a 3,230,621 parameter neural network comparing the baseline CPU execution time with the Accelerated WEKA execution on a GTX 1080Ti GPU. The experiments used a small subset of the MNIST dataset while increasing the number of epochs

This benchmarking shows that Accelerated WEKA provides the most benefit to compute-intensive tasks with larger datasets. Small datasets like the RBFa5k and RBFa5kn1k (possessing 100 and 1,000 instances, respectively) present bad speedup, which happens because the dataset is too small to make the overhead of moving things to GPU memory worthwhile. 

Such behavior is noticeable in the A100 (Table 4) experiments, where the architecture is more complex. The benefits of using it start to kick in at the 100,000 instances or bigger datasets. For instance, The RBF datasets with 100,000 instances show ~3 and 4x speedup, which is still lackluster but shows improvement. Bigger datasets like the covertype dataset (~700,000 instances) or the RBFa50n1m dataset (1 million instances) show speedups of 56X and 271X, respectively. Note that for Deep Learning tasks, the Speedup can reach over 20X even with the GTX 1080Ti.

Key takeaways (Tie back to the Call to Action)

Accelerated WEKA will help you supercharge WEKA using RAPIDS. Accelerated WEKA helps with efficient algorithm implementations of RAPIDS and has an easy-to-use GUI. The installation process is simplified using the Conda environment, making it straightforward to use Accelerated WEKA from the beginning.

If you use Accelerated WEKA, please use the hashtag #AcceleratedWEKA on social media. Also, please refer to the documentation for the correct publication to cite Accelerated WEKA in academic work and find out more details about the project. 

Contributing to Accelerated WEKA

WEKA is freely available under the GPL open-source license and so is Accelerated WEKA. In fact, Accelerated WEKA is provided through Conda to automate the installation of the required tools for the environment, and the additions to the source code are published to the main packages for WEKA. Contributions and bug fixes can be contributed as patch files and posted to the WEKA mailing list.

Acknowledgments

We would like to thank Ettikan Karuppiah, Nick Becker, Brian Kloboucher, and Dr. Johan Barthelemy from NVIDIA for the technical support they provided during the execution of this project. Their insights were essential in helping us reach the goal of efficient integration with the RAPIDS library. In addition, we would like to thank Johan Barthelemy for running benchmarks in extra graphic cards.

Categories
Misc

Convert to numpy

Hello members,

So my question is I have a variable which of type ops.Tensor. I need to convert this variable to a numpy variable. I tried different solutions online but in those cases the variable needs to be ops.EagerTensor to convert the variable into numpy object(. numpy (), tf.make_ndarray etc). Soo how can I convert my tensor object to eager tensor object or directly to numpy??

submitted by /u/Anonymous_Guy_12
[visit reddit] [comments]

Categories
Misc

Building a Four-Node Cluster with NVIDIA Jetson Xavier NX

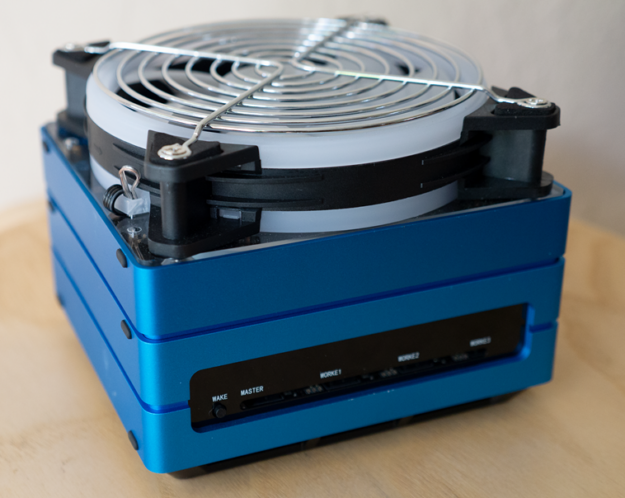
Create a compact desktop cluster with four NVIDIA Jetson Xavier NX modules to accelerate training and inference of AI and deep learning workflows.
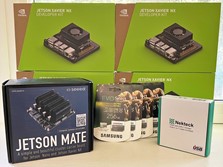
Following in the footsteps of large-scale supercomputers like the NVIDIA DGX SuperPOD, this post guides you through the process of creating a small-scale cluster that fits on your desk. Below is the recommended hardware and software to complete this project. This small-scale cluster can be utilized to accelerate training and inference of artificial intelligence (AI) and deep learning (DL) workflows, including the use of containerized environments from sources such as the NVIDIA NGC Catalog.

Hardware:

Picture of hardware components used in this post

While the Seeed Studio Jetson Mate, USB-C PD power supply, and USB-C cable are not required, they were used in this post and are highly recommended for a neat and compact desktop cluster solution.

Software:

For more information, see the NVIDIA Jetson Xavier NX development kit.

Installation

Write the JetPack image to a microSD card and perform initial JetPack configuration steps:

The first iteration through this post is targeted toward the Slurm control node (slurm-control). After you have the first node configured, you can either choose to repeat each step for each module, or you can clone this first microSD card for the other modules; more detail on this later.

For more information about the flashing and initial setup of JetPack, see Getting Started with Jetson Xavier NX Developer Kit.

While following the getting started guide above:

  • Skip the wireless network setup portion as a wired connection will be used.
  • When selecting a username and password, choose what you like and keep it consistent across all nodes.
  • Set the computer’s name to be the target node you’re currently working with, the first being slurm-control.
  • When prompted to select a value for Nvpmodel Mode, choose MODE_20W_6CORE for maximum performance.

After flashing and completing the getting started guide, run the following commands:

echo "`id -nu` ALL=(ALL) NOPASSWD: ALL" | sudo tee /etc/sudoers.d/`id -nu`
sudo systemctl mask snapd.service apt-daily.service apt-daily-upgrade.service
sudo systemctl mask apt-daily.timer apt-daily-upgrade.timer
sudo apt update
sudo apt upgrade -y
sudo apt autoremove -y

Disable NetworkManager, enable systemd-networkd, and configure network [DHCP]:

sudo systemctl disable NetworkManager.service NetworkManager-wait-online.service NetworkManager-dispatcher.service network-manager.service
sudo systemctl mask avahi-daemon
sudo systemctl enable systemd-networkd
sudo ln -sf /run/systemd/resolve/stub-resolv.conf /etc/resolv.conf
cat  /dev/null

[Match]
Name=eth0

[Network]
DHCP=ipv4
MulticastDNS=yes

[DHCP]
UseHostname=false
UseDomains=false
EOF

sudo sed -i "/#MulticastDNS=/cMulticastDNS=yes" /etc/systemd/resolved.conf
sudo sed -i "/#Domains=/cDomains=local" /etc/systemd/resolved.conf

Configure the node hostname:

If you have already set the hostname in the initial JetPack setup, this step can be skipped.

[slurm-control]

sudo hostnamectl set-hostname slurm-control
sudo sed -i "s/127.0.1.1.*/127.0.1.1t`hostname`/" /etc/hosts

[compute-node]

Compute nodes should follow a particular naming convention to be easily addressable by Slurm. Use a consistent identifier followed by a sequentially incrementing number (for example, node1, node2, and so on). In this post, I suggest using nx1, nx2, and nx3 for the compute nodes. However, you can choose anything that follows a similar convention.

sudo hostnamectl set-hostname nx[1-3]
sudo sed -i "s/127.0.1.1.*/127.0.1.1t`hostname`/" /etc/hosts

Create users and groups for Munge and Slurm:

sudo groupadd -g 1001 munge
sudo useradd -m -c "MUNGE" -d /var/lib/munge -u 1001 -g munge -s /sbin/nologin munge
sudo groupadd -g 1002 slurm
sudo useradd -m -c "SLURM workload manager" -d /var/lib/slurm -u 1002 -g slurm -s /bin/bash slurm

Install Munge:

sudo apt install libssl-dev -y
git clone https://github.com/dun/munge
cd munge 
./bootstrap
./configure
sudo make install -j6
sudo ldconfig
sudo mkdir -m0755 -pv /usr/local/var/run/munge
sudo chown -R munge: /usr/local/etc/munge /usr/local/var/run/munge /usr/local/var/log/munge

Create or copy the Munge encryption keys:

[slurm-control]

sudo -u munge mungekey --verbose

[compute-node]

sudo sftp -s 'sudo /usr/lib/openssh/sftp-server' `id -nu`@slurm-control 


Start Munge and test the local installation:

sudo systemctl enable munge
sudo systemctl start munge
munge -n | unmunge

Expected result: STATUS: Success (0)

Verify that the Munge encryption keys match from a compute node to slurm-control:

[compute-node]

munge -n | ssh slurm-control unmunge

Expected result: STATUS: Success (0)

Install Slurm (20.11.9):

cd ~
wget https://download.schedmd.com/slurm/slurm-20.11-latest.tar.bz2
tar -xjvf slurm-20.11-latest.tar.bz2
cd slurm-20.11.9
./configure --prefix=/usr/local
sudo make install -j6

Index the Slurm shared objects and copy the systemd service files:

sudo ldconfig -n /usr/local/lib/slurm
sudo cp etc/*.service /lib/systemd/system

Create directories for Slurm and apply permissions:

sudo mkdir -pv /usr/local/var/{log,run,spool} /usr/local/var/spool/{slurmctld,slurmd}
sudo chown slurm:root /usr/local/var/spool/slurm*
sudo chmod 0744 /usr/local/var/spool/slurm*

Create a Slurm configuration file for all nodes:

For this step, you can follow the included commands and use the following configuration file for the cluster (recommended). To customize variables related to Slurm, use the configuration tool.

cat  /dev/null
#slurm.conf for all nodes#
ClusterName=SlurmNX
SlurmctldHost=slurm-control
MpiDefault=none
ProctrackType=proctrack/pgid
ReturnToService=2
SlurmctldPidFile=/usr/local/var/run/slurmctld.pid
SlurmctldPort=6817
SlurmdPidFile=/usr/local/var/run/slurmd.pid
SlurmdPort=6818
SlurmdSpoolDir=/usr/local/var/spool/slurmd
SlurmUser=slurm
StateSaveLocation=/usr/local/var/spool/slurmctld
SwitchType=switch/none
InactiveLimit=0
KillWait=30
MinJobAge=300
SlurmctldTimeout=120
SlurmdTimeout=300
Waittime=0
SchedulerType=sched/backfill
SelectType=select/cons_tres
SelectTypeParameters=CR_Core_Memory
JobCompType=jobcomp/none
SlurmctldDebug=info
SlurmctldLogFile=/usr/local/var/log/slurmctld.log
SlurmdDebug=info
SlurmdLogFile=/usr/local/var/log/slurmd.log

NodeName=nx[1-3] RealMemory=7000 Sockets=1 CoresPerSocket=6 ThreadsPerCore=1 State=UNKNOWN
PartitionName=compute Nodes=ALL Default=YES MaxTime=INFINITE State=UP

EOF
sudo chmod 0744 /usr/local/etc/slurm.conf
sudo chown slurm: /usr/local/etc/slurm.conf

Install Enroot 3.3.1:

cd ~
sudo apt install curl jq parallel zstd -y
arch=$(dpkg --print-architecture)curl -fSsL -O https://github.com/NVIDIA/enroot/releases/download/v3.3.1/enroot_3.3.1-1_${arch}.deb
sudo dpkg -i enroot_3.3.1-1_${arch}.deb

Install Pyxis (0.13):

git clone https://github.com/NVIDIA/pyxis
cd pyxis
sudo make install -j6

Create the Pyxis plug-in directory and config file:

sudo mkdir /usr/local/etc/plugstack.conf.d
echo "include /usr/local/etc/plugstack.conf.d/*" | sudo tee /usr/local/etc/plugstack.conf > /dev/null

Link the Pyxis default config file to the plug-in directory:

sudo ln -s /usr/local/share/pyxis/pyxis.conf /usr/local/etc/plugstack.conf.d/pyxis.conf

Verify Enroot/Pyxis installation success:

srun --help | grep container-image

Expected result: --container-image=[USER@][REGISTRY#]IMAGE[:TAG]|PATH

Finalization

When replicating the configuration across the remaining nodes, label the JetsonNX modules with the assigned node name and/or the microSD cards. This helps prevent confusion later on when moving modules or cards around.

There are two different methods in which you can replicate your installation to the remaining modules: manual configuration or cloning slurm-control. Read over both methods and choose which method you prefer.

Manually configure the remaining nodes

Follow the “Enable and start the Slurm service daemon” section below for your current module, then repeat the entire process for the remaining modules, skipping any steps tagged under [slurm-control]. When all modules are fully configured, install them into the Jetson Mate in their respective slots, as outlined in the “Install all Jetson Xavier NX modules into the enclosure” section.

Clone slurm-control installation for remaining nodes

To avoid repeating all installation steps for each node, clone the slurm-control node’s card as a base image and flash it onto all remaining cards. This requires a microSD-to-SD card adapter if you have only one multi-port card reader and want to do card-to-card cloning. Alternatively, creating an image file from the source slurm-control card onto the local machine and then flashing target cards is also an option.

  1. Shut down the Jetson that you’ve been working with, remove the microSD card from the module, and insert it into the card reader.
  2. If you’re performing a physical card to card clone (using Balena Etcher, dd, or any other utility that will do sector by sector writes), insert the blank target microSD into the SD card adapter, then insert it into the card reader.
  3. Identify which card is which for the source (microSD) and destination (SD card) in the application that you’re using and start the cloning process.
  4. If you are creating an image file, using a utility of your choice, create an image file from the slurm-control microSD card on the local machine, then remove that card and flash the remaining blank cards using that image.
  5. After cloning is completed, insert a cloned card into a Jetson module and power on. Configure the node hostname for a compute node, then proceed to enable and start the Slurm service daemon. Repeat this process for all remaining card/module pairs.

Enable and start the Slurm service daemon:

[slurm-control]

sudo systemctl enable slurmctld
sudo systemctl start slurmctld

[compute-node]

sudo systemctl enable slurmd
sudo systemctl start slurmd

Install all Jetson Xavier NX modules into the enclosure

First power down any running modules, then remove them from their carriers. Install all Jetson modules into the Seeed Studio Jetson Mate, ensuring that the control node is placed in the primary slot labeled “MASTER”, and compute nodes 1-3 are placed in secondary slots labeled “WORKE 1, 2, and 3” respectively. Optional fan extension cables are available from the Jetson Mate kit for each module.

The video output on the enclosure is connected to the primary module slot, as is the vertical USB2 port, and USB3 port 1. All other USB ports are wired to the other modules according to their respective port numbers.

Photo of fully assembled cluster on a table.
Figure 1. Fully assembled cluster inside of the SeeedStudio Jetson Mate

Troubleshooting

This section contains some helpful commands to assist in troubleshooting common networking and Slurm-related issues.

Test network configuration and connectivity

The following command should show eth0 in the routable state, with IP address information obtained from the DHCP server:

networkctl status

The command should respond with the local node’s hostname and .local as the domain (for example, slurm-control.local), along with DHCP assigned IP addresses:

host `hostname`

Choose a compute node hostname that is configured and online. It should respond similarly to the previous command. For example: host nx1 – nx1.local has address 192.168.0.1. This should also work for any other host that has an mDNS resolver daemon running on your LAN.

host [compute-node-hostname]

All cluster nodes should be pingable by all other nodes, and all local LAN IP addresses should be pingable as well, such as your router.

ping [compute-node-hostname/local-network-host/ip]

Test the external DNS name resolution and confirm that routing to the internet is functional:

ping www.nvidia.com

Check Slurm cluster status and node communication

The following command shows the current status of the cluster, including node states:

sinfo -lNe

If any nodes in the sinfo output show UNKNOWN or DOWN for their state, the following command signals to the specified nodes to change their state and become available for job scheduling ([ ] specifies a range of numbers following the hostname ‘nx’):

scontrol update NodeName=hostname[1-3] State=RESUME

The following command runs hostname on all available compute nodes. Nodes should respond back with their corresponding hostname in your console.

srun -N3 hostname

Summary

You’ve now successfully built a multi-node Slurm cluster that fits on your desk. There’s a vast amount of benchmarks, projects, workloads, and containers that you can now run on your mini-cluster. Feel free to share your feedback on this post and, of course, anything that your new cluster is being used for.

Power on and enjoy Slurm!

For more information, see the following resources:

Acknowledgments

Special thanks to Robert Sohigian, a technical marketing engineer on our team, for all the guidance in creating this post, providing feedback on the clarity of instructions, and for being the lab rat in multiple runs of building this cluster. Your feedback was invaluable and made this post what it is!

Categories
Misc

Driving Data Center Innovation Through Ecosystem Partners

Leading security, storage, and networking vendors are joining the DOCA and DPU community.

The DPU, or data processing unit, is a new class of programmable processors that specializes in moving data around the data center and now joins CPUs and GPUs as the third pillar of modern computing. NVIDIA DOCA is core to the NVIDIA Bluefield DPU offering because it provides ecosystem partners with an open platform to deliver the advanced networking, storage, and security services needed today. 

DOCA  unlocks data center innovation by enabling an open ecosystem and developer community to rapidly create applications and services on top of Bluefield DPUs, using industry-standard open APIs and frameworks. 

Integral to our customers’ success, and our own, is the collaboration with our ecosystem partners. For more than 15 years, our ecosystem partners have harnessed the power of CUDA to develop the world’s most effective accelerated applications for a multitude of use cases. 

The NVIDIA CUDA Toolkit provides everything that is needed to develop GPU-accelerated applications. Similarly, the NVIDIA DOCA Software Framework is an open SDK that enables you to rapidly create applications and services on top of Bluefield DPUs.  

Where partners have achieved such success with NVIDIA GPUs and CUDA, we are emulating that formula with our DPU portfolio and DOCA. Moreover, we recognize that to deliver best-in-class solutions for customers, we need to partner with the world’s leading technology vendors. Proprietary applications have their place, but who better to provide world-class security, storage, and networking solutions, than the world’s leading vendors in those fields?

A meeting of the minds

During the last two years, our ecosystem partners have been delivering innovative solutions and services essential for digital transformation. The most turbulent period in recent history has forced us all to find new ways to collaborate and embrace technology at a rate never expected. Not only have we had to adapt as individuals, but organizations across the globe have been forced to re-think their day-to-day activities.

We work closely with our partners to define and create more DOCA libraries and services to address innovative use cases.  More than ever, we’re witnessing a realignment between technology requirements in the data center and ever-changing business priorities. In turn, matching customers to ecosystem partners provides an opportunity to create customized technology solutions tuned to meet specific business objectives.

Today, NVIDIA is working with leading platform vendors and partners to integrate and expand DOCA support for commercial distributions on BlueField DPUs. Dozens of industry leaders, including VMWare, Red Hat, DDN, Aria Cybersecurity, and Juniper Networks, have started to integrate their solutions using the DPU/DOCA architecture. You’ll start to see more new applications in the coming year. 

Earlier this year, Palo Alto Networks, a global cybersecurity leader developed the first next-generation firewall (NGFW) specifically designed to be accelerated by the BlueField DPU. This first-to-market, hardware-accelerated software NGFW is a prime example of how the BlueField DPU boosts performance and optimizes data center security coverage and efficiency.

Third-party developers can create and distribute DPU-accelerated applications with the DOCA SDK, which is fully integrated into the NGC catalog of containerized software. Such accelerated solutions will be wide-ranging, including advanced applications for infrastructure, storage, and security. It will be the key to unlocking data center innovation.

Try DOCA today

NVIDIA DOCA is the key to unlocking the potential of the NVIDIA BlueField DPU to offload, accelerate, and isolate data center workloads. With DOCA, you can program the data center infrastructure of tomorrow by creating software-defined, cloud-native, DPU-accelerated services with zero-trust protection to address the increasing performance and security demands of modern data centers.

To start developing on DOCA: