If you are a DirectX 12 (DX12) game developer, you may have noticed that GPU times displayed in real time in your game HUD may change over time for a given…
If you are a DirectX 12 (DX12) game developer, you may have noticed that GPU times displayed in real time in your game HUD may change over time for a given pass. This may be the case even if nothing has changed on the application side.
One reason for GPU time variations may be GPU Boost dynamically changing the GPU core clock frequency. Still, even with GPU Boost disabled using the DX12 SetStablePowerState API, GPU timings measured in-game may still change unexpectedly from run to run, or from frame to frame. One factor to consider is whether background driver optimizations were engaged and when their resulting optimized shaders were deployed.
This post provides best practices for performing in-game GPU profiling while monitoring the state of the background driver optimizations, using the DX12 SetBackgroundProcessingMode API on NVIDIA GPUs.
Keep background driver optimizations always on
The DX12 driver automatically disables all of its background optimizations if it detects a risk that the CPU overhead may negatively impact the frame rate of the DX12 application. As a result, running with a Debug build of an application may result in less optimal GPU workloads, for instance. Even for a Release build, the driver background optimizations may be turned on and off dynamically from frame to frame.
To avoid getting inconsistent profiling results depending on the CPU load of your application, you can request that the driver background optimizations stay always on, even if it may degrade frame rate. Use the following call (once is enough–no need to redo for every frame):
Even with driver background optimizations always on, the optimizations typically require multiple frames to collect observations. The observations are then used to compile a shader asynchronously. In contrast, DX12 Create calls block for compiles. This asynchronous delivery of new binaries can result in GPU performance for one shader suddenly changing from one frame to the next without anything changing on the application side.
Understandably, this can cause a great deal of confusion in timing your shaders. You should still aim to measure these background-optimized shaders to avoid application optimization work that the driver is already providing. To know when all background driver optimizations have completed so you can take GPU performance measurements in your in-game profiler, use the following code on Present. Continue to render frames until wantMoreFrames is returned as false.
The wantMoreFrames return value combines two pieces of information from the driver: “are background compiles currently running” and “does the driver want more frames demonstrated to the optimizers.”
We recommend that you display this Boolean in real time in your game HUD next to your in-game GPU timings.
It is possible that wantMoreFrames never becomes false if the driver continues generating new binaries. We recommend that you pause your game time and do not move the camera to avoid this possibility.
If the wantMoreFrames Boolean never turns false in your case, even after you have paused all simulations, you can fall back to looking at whether the GPU timings in your game HUD appear to have settled.
Reset the background processing mode to the default mode
Use the following call to return to the default mode of the DX12 driver. In this mode, the driver turns background optimizations on and off depending on internal heuristics.
For more deterministic performance measurements on NVIDIA GPUs using your DX12 in-game GPU profiler, we recommend that you display the wantMoreFrames Boolean in your game HUD next to your in-game GPU timings to know whether background driver optimizations are in flight.
By using the DX12 SetBackgroundProcessingMode API in your game engine in this way during development, your in-game GPU profiler will provide more reliable information. By using the ALLOW_INTRUSIVE_MEASUREMENTS background processing mode, you should no longer get different GPU timings depending on the CPU load of your game. By waiting for wantMoreFrames to be false, you can make sure that you always look at the GPU performance of the fully optimized shaders.
This week, the 61st annual meeting of the Association for Computational Linguistics (ACL), a premier conference covering a broad spectrum of research areas that are concerned with computational approaches to natural language, is taking place online.
As a leader in natural language processing and understanding, and a Diamond Level sponsor of ACL 2023, Google will showcase the latest research in the field with over 50 publications, and active involvement in a variety of workshops and tutorials.
If you’re registered for ACL 2023, we hope that you’ll visit the Google booth to learn more about the projects at Google that go into solving interesting problems for billions of people. You can also learn more about Google’s participation below (Google affiliations in bold).
Board and Organizing Committee
Area chairs include: Dan Garrette
Workshop chairs include: Annie Louis
Publication chairs include: Lei Shu
Program Committee includes: Vinodkumar Prabhakaran, Najoung Kim, Markus Freitag
Samuel Cahyawijaya, Holy Lovenia, Alham Fikri Aji, Genta Winata, Bryan Wilie, Fajri Koto, Rahmad Mahendra, Christian Wibisono, Ade Romadhony, Karissa Vincentio, Jennifer Santoso, David Moeljadi, Cahya Wirawan, Frederikus Hudi, Muhammad Satrio Wicaksono, Ivan Parmonangan, Ika Alfina, Ilham Firdausi Putra, Samsul Rahmadani, Yulianti Oenang, Ali Septiandri, James Jaya, Kaustubh Dhole, Arie Suryani, Rifki Afina Putri, Dan Su, Keith Stevens, Made Nindyatama Nityasya, Muhammad Adilazuarda, Ryan Hadiwijaya, Ryandito Diandaru, Tiezheng Yu, Vito Ghifari, Wenliang Dai, Yan Xu, Dyah Damapuspita, Haryo Wibowo, Cuk Tho, Ichwanul Karo Karo, Tirana Fatyanosa, Ziwei Ji, Graham Neubig, Timothy Baldwin, Sebastian Ruder, Pascale Fung, Herry Sujaini, Sakriani Sakti, Ayu Purwarianti
Niklas Muennighoff, Thomas Wang, Lintang Sutawika, Adam Roberts, Stella Biderman, Teven Le Scao, M. Saiful Bari, Sheng Shen, Zheng Xin Yong, Hailey Schoelkopf, Xiangru Tang, Dragomir Radev, Alham Fikri Aji, Khalid Almubarak, Samuel Albanie, Zaid Alyafeai, Albert Webson, Edward Raff, Colin Raffel
Lining Zhang, Simon Mille, Yufang Hou, Daniel Deutsch, Elizabeth Clark, Yixin Liu, Saad Mahamood, Sebastian Gehrmann, Miruna Clinciu, Khyathi Raghavi Chandu and João Sedoc
Mirac Suzgun, Nathan Scales, Nathanael Scharli, Sebastian Gehrmann, Yi Tay, Hyung Won Chung, Aakanksha Chowdhery, Quoc Le, Ed Chi, Denny Zhou, Jason Wei
NVIDIA RTX is spinning new cycles for designs. Trek Bicycle is using GPUs to bring design concepts to life. The Wisconsin-based company, one of the largest bicycle manufacturers in the world, aims to create bikes with the highest-quality craftsmanship. With its new partner Lidl, an international retailer chain, Trek Bicycle also owns a cycling team, Read article >
Robotics simulation enables virtual training and programming that can use physics-based digital representations of environments, robots, machines, objects, and…
Robotics simulation enables virtual training and programming that can use physics-based digital representations of environments, robots, machines, objects, and other assets.
Posted by Sanjay Subramanian, PhD student, UC Berkeley, and Arsha Nagrani, Research Scientist, Google Research, Perception Team
Visual question answering (VQA) is a machine learning task that requires a model to answer a question about an image or a set of images. Conventional VQA approaches need a large amount of labeled training data consisting of thousands of human-annotated question-answer pairs associated with images. In recent years, advances in large-scale pre-training have led to the development of VQA methods that perform well with fewer than fifty training examples (few-shot) and without any human-annotated VQA training data (zero-shot). However, there is still a significant performance gap between these methods and state-of-the-art fully supervised VQA methods, such as MaMMUT and VinVL. In particular, few-shot methods struggle with spatial reasoning, counting, and multi-hop reasoning. Furthermore, few-shot methods have generally been limited to answering questions about single images.
To improve accuracy on VQA examples that involve complex reasoning, in “Modular Visual Question Answering via Code Generation,” to appear at ACL 2023, we introduce CodeVQA, a framework that answers visual questions using program synthesis. Specifically, when given a question about an image or set of images, CodeVQA generates a Python program (code) with simple visual functions that allow it to process images, and executes this program to determine the answer. We demonstrate that in the few-shot setting, CodeVQA outperforms prior work by roughly 3% on the COVR dataset and 2% on the GQA dataset.
CodeVQA
The CodeVQA approach uses a code-writing large language model (LLM), such as PALM, to generate Python programs (code). We guide the LLM to correctly use visual functions by crafting a prompt consisting of a description of these functions and fewer than fifteen “in-context” examples of visual questions paired with the associated Python code for them. To select these examples, we compute embeddings for the input question and of all of the questions for which we have annotated programs (a randomly chosen set of fifty). Then, we select questions that have the highest similarity to the input and use them as in-context examples. Given the prompt and question that we want to answer, the LLM generates a Python program representing that question.
We instantiate the CodeVQA framework using three visual functions: (1) query, (2) get_pos, and (3) find_matching_image.
Query, which answers a question about a single image, is implemented using the few-shot Plug-and-Play VQA (PnP-VQA) method. PnP-VQA generates captions using BLIP — an image-captioning transformer pre-trained on millions of image-caption pairs — and feeds these into a LLM that outputs the answers to the question.
Get_pos, which is an object localizer that takes a description of an object as input and returns its position in the image, is implemented using GradCAM. Specifically, the description and the image are passed through the BLIP joint text-image encoder, which predicts an image-text matching score. GradCAM takes the gradient of this score with respect to the image features to find the region most relevant to the text.
Find_matching_image, which is used in multi-image questions to find the image that best matches a given input phrase, is implemented by using BLIP text and image encoders to compute a text embedding for the phrase and an image embedding for each image. Then the dot products of the text embedding with each image embedding represent the relevance of each image to the phrase, and we pick the image that maximizes this relevance.
The three functions can be implemented using models that require very little annotation (e.g., text and image-text pairs collected from the web and a small number of VQA examples). Furthermore, the CodeVQA framework can be easily generalized beyond these functions to others that a user might implement (e.g., object detection, image segmentation, or knowledge base retrieval).
Illustration of the CodeVQA method. First, a large language model generates a Python program (code), which invokes visual functions that represent the question. In this example, a simple VQA method (query) is used to answer one part of the question, and an object localizer (get_pos) is used to find the positions of the objects mentioned. Then the program produces an answer to the original question by combining the outputs of these functions.
Results
The CodeVQA framework correctly generates and executes Python programs not only for single-image questions, but also for multi-image questions. For example, if given two images, each showing two pandas, a question one might ask is, “Is it true that there are four pandas?” In this case, the LLM converts the counting question about the pair of images into a program in which an object count is obtained for each image (using the query function). Then the counts for both images are added to compute a total count, which is then compared to the number in the original question to yield a yes or no answer.
We evaluate CodeVQA on three visual reasoning datasets: GQA (single-image), COVR (multi-image), and NLVR2 (multi-image). For GQA, we provide 12 in-context examples to each method, and for COVR and NLVR2, we provide six in-context examples to each method. The table below shows that CodeVQA improves consistently over the baseline few-shot VQA method on all three datasets.
Method
GQA
COVR
NLVR2
Few-shot PnP-VQA
46.56
49.06
63.37
CodeVQA
49.03
54.11
64.04
Results on the GQA, COVR, and NLVR2 datasets, showing that CodeVQA consistently improves over few-shot PnP-VQA. The metric is exact-match accuracy, i.e., the percentage of examples in which the predicted answer exactly matches the ground-truth answer.
We find that in GQA, CodeVQA’s accuracy is roughly 30% higher than the baseline on spatial reasoning questions, 4% higher on “and” questions, and 3% higher on “or” questions. The third category includes multi-hop questions such as “Are there salt shakers or skateboards in the picture?”, for which the generated program is shown below.
img = open_image("Image13.jpg")
salt_shakers_exist = query(img, "Are there any salt shakers?")
skateboards_exist = query(img, "Are there any skateboards?")
if salt_shakers_exist == "yes" or skateboards_exist == "yes":
    answer = "yes"
else:
    answer = "no"
In COVR, we find that CodeVQA’s gain over the baseline is higher when the number of input images is larger, as shown in the table below. This trend indicates that breaking the problem down into single-image questions is beneficial.
Number of images
Method
1
2
3
4
5
Few-shot PnP-VQA
91.7
51.5
48.3
47.0
46.9
CodeVQA
75.0
53.3
48.7
53.2
53.4
Conclusion
We present CodeVQA, a framework for few-shot visual question answering that relies on code generation to perform multi-step visual reasoning. Exciting directions for future work include expanding the set of modules used and creating a similar framework for visual tasks beyond VQA. We note that care should be taken when considering whether to deploy a system such as CodeVQA, since vision-language models like the ones used in our visual functions have been shown to exhibit social biases. At the same time, compared to monolithic models, CodeVQA offers additional interpretability (through the Python program) and controllability (by modifying the prompts or visual functions), which are useful in production systems.
Acknowledgements
This research was a collaboration between UC Berkeley’s Artificial Intelligence Research lab (BAIR) and Google Research, and was conducted by Sanjay Subramanian, Medhini Narasimhan, Kushal Khangaonkar, Kevin Yang, Arsha Nagrani, Cordelia Schmid, Andy Zeng, Trevor Darrell, and Dan Klein.
Organizations are increasingly adopting hybrid and multi-cloud strategies to access the latest compute resources, consistently support worldwide customers, and…
Organizations are increasingly adopting hybrid and multi-cloud strategies to access the latest compute resources, consistently support worldwide customers, and optimize cost. However, a major challenge that engineering teams face is operationalizing AI applications across different platforms as the stack changes. This requires MLOps teams to familiarize themselves with different environments and developers to customize applications to run across target platforms.
NVIDIA offers a consistent, full stack to develop on a GPU-powered on-premises or on-cloud instance. You can then deploy that AI application on any GPU-powered platform without code changes.
Introducing the latest NVIDIA Virtual Machine Image
The NVIDIA Cloud Native Stack Virtual Machine Image (VMI) is GPU-accelerated. It comes pre-installed with Cloud Native Stack, which is a reference architecture that includes upstream Kubernetes and the NVIDIA GPU Operator. NVIDIA Cloud Native Stack VMI enables you to build, test, and run GPU-accelerated containerized applications orchestrated by Kubernetes.
The NVIDIA GPU Operator automates the lifecycle management of the software required to expose GPUs on Kubernetes. It enables advanced functionality, including better GPU performance, utilization, and telemetry. Certified and validated for compatibility with industry-leading Kubernetes solutions, GPU Operator enables organizations to focus on building applications, rather than managing Kubernetes infrastructure.
NVIDIA Cloud Native Stack VMI is available on AWS, Azure, and GCP.
Now Available: Enterprise support by NVIDIA
For enterprise support for NVIDIA Cloud Native Stack VMI and GPU Operator, purchase NVIDIA AI Enterprise through an NVIDIA partner.
Developing AI solutions from concept to deployment is not easy. Keep your AI projects on track with NVIDIA AI Enterprise Support Services. Included with the purchase of the NVIDIA AI Enterprise software suite, this comprehensive offering gives you direct access to NVIDIA AI experts, defined service-level agreements, and control of your upgrade and maintenance schedules with long-term support options. Additional services, including training and AI workload onboarding, are available.
Run:ai is now certified on NVIDIA AI Enterprise
Run:ai, an industry leader in compute orchestration for AI workloads, has certified NVIDIA AI Enterprise, an end-to-end, secure, cloud-native suite of AI software, on their Atlas platform. This additional certification enables enterprises to accelerate the data science pipeline. They can focus on streamlining the development and deployment of predictive AI models to automate essential processes and gain rapid insights from data.
Run:ai provides an AI Computing platform that simplifies the access, management, and utilization of GPUs in cloud and on-premises clusters. Smart scheduling and advanced fractional GPU capabilities ensure that you get the right amount of compute for the job.
Run:ai Atlas includes GPU Orchestration capabilities to help researchers consume GPUs more efficiently. They do this by automating the orchestration of AI workloads and the management and virtualization of hardware resources across teams and clusters.
Run:ai can be installed on any Kubernetes cluster, to provide efficient scheduling and monitoring capabilities to your AI infrastructure. With the NVIDIA Cloud Native Stack VMI, you can add cloud instances to a Kubernetes cluster so that they become GPU-powered worker nodes of the cluster.
Here’s testimony from one of our team members: “As an engineer, without the NVIDIA Cloud Native Stack VMI, there is a lot of manual work involved. With the Cloud Native Stack VMI, it was two clicks and took care of provisioning Kubernetes and Docker and the GPU Operator. It was easier and faster to get started on my work.”
Ensure that the necessary prerequisites have been met and install Run:ai using the Cluster Install instructions. After the installation, on the Overview dashboard, you should see that the metrics begin to populate. On the Clusters tab, you should also see the cluster as connected.
Next, add a few command components to the kube-apiserver.yaml file to enable user authentication on the Run:ai platform. For more information, see Administration User Interface Setup.
By default, you can find the kube-apiserver.yaml file in the following directory:
Set up the Unified UI and create a new project. Projects help to dictate GPU quota guarantees for data scientists and researchers who are using the Run:ai platform.
Name the new project and give the project at least one assigned GPU. For this post, I created one project with a two-GPU quota and another project with no GPU quota, labeled nvaie-high-priority and nvaie-low-priority, respectively After the project is created, you can install the Run:ai CLI tool, which enables you to submit workloads to the cluster.
The following commands use the runai CLI to submit a job (job1 or job2) leveraging a Docker image called quickstart. Quickstart contains TensorFlow, CUDA, a model, and data that feeds in and trains the model. It leverages one GPU for training (-g 1) and is submitted on behalf of the low-priority or high-priority project denoted by the -p parameter.
Deploy a few test jobs to show some of Run:ai’s orchestration functionality by running:
Both workloads are now training on the GPUs, as you can see on the Overview dashboard.
You can submit an additional workload to highlight your job preemption capabilities. Currently, the nvaie-high-priority project is guaranteed access to both GPUs since their Assigned GPU quota is set to 2. You can submit an additional workload for the nvaie-high-priority project and observe that you are preempting the nvaie-low-priority job.
The job preemption enables you to look at the checkpointing process for the training workloads, save the current progress at the checkpoint, and then preempt the workload to remove it from the GPU. Save the training progress and free up the GPU for a higher-priority workload to run.
If you go back to the overview dashboard, you’ll see the two jobs running for the nvaie-high-priority project and the workload from nvaie-low-priority preempted and placed back into the pending queue. The workload in the pending queue is automatically rescheduled when a GPU becomes available.
To clean up your jobs, run the following commands:
NVIDIA offers a consistent, full stack to develop on a GPU-powered on-premises or on-cloud instance. Developers and MLOps can then deploy that AI application on any GPU-powered platform without code change.
Run:ai, an industry leader in compute orchestration for AI workloads, has certified NVIDIA AI Enterprise, an end-to-end, secure, cloud-native suite of AI software, on its Atlas platform. You can purchase NVIDIA AI Enterprise through an NVIDIA Partner to obtain enterprise support for NVIDIA VMI and GPU Operator. Included with the purchase of the NVIDIA AI Enterprise software suite, this comprehensive offering gives you direct access to NVIDIA AI experts, defined service-level agreements, and control of your upgrade and maintenance schedules with long-term support options.
For more information, see the following resources:
Posted by Kuniaki Saito, Student Researcher, Google Research, Cloud AI Team, and Kihyuk Sohn, Research Scientist, Google Research
Image retrieval plays a crucial role in search engines. Typically, their users rely on either image or text as a query to retrieve a desired target image. However, text-based retrieval has its limitations, as describing the target image accurately using words can be challenging. For instance, when searching for a fashion item, users may want an item whose specific attribute, e.g., the color of a logo or the logo itself, is different from what they find in a website. Yet searching for the item in an existing search engine is not trivial since precisely describing the fashion item by text can be challenging. To address this fact, composed image retrieval (CIR) retrieves images based on a query that combines both an image and a text sample that provides instructions on how to modify the image to fit the intended retrieval target. Thus, CIR allows precise retrieval of the target image by combining image and text.
However, CIR methods require large amounts of labeled data, i.e., triplets of a 1) query image, 2) description, and 3) target image. Collecting such labeled data is costly, and models trained on this data are often tailored to a specific use case, limiting their ability to generalize to different datasets.
To address these challenges, in “Pic2Word: Mapping Pictures to Words for Zero-shot Composed Image Retrieval”, we propose a task called zero-shot CIR (ZS-CIR). In ZS-CIR, we aim to build a single CIR model that performs a variety of CIR tasks, such as object composition,attribute editing, or domain conversion, without requiring labeled triplet data. Instead, we propose to train a retrieval model using large-scale image-caption pairs and unlabeled images, which are considerably easier to collect than supervised CIR datasets at scale. To encourage reproducibility and further advance this space, we also release the code.
Description of existing composed image retrieval model.
We train a composed image retrieval model using image-caption data only. Our model retrieves images aligned with the composition of the query image and text.
Method overview
We propose to leverage the language capabilities of the language encoder in the contrastive language-image pre-trained model (CLIP), which excels at generating semantically meaningful language embeddings for a wide range of textual concepts and attributes. To that end, we use a lightweight mapping sub-module in CLIP that is designed to map an input picture (e.g., a photo of a cat) from the image embedding space to a word token (e.g., “cat”) in the textual input space. The whole network is optimized with the vision-language contrastive loss to again ensure the visual and text embedding spaces are as close as possible given a pair of an image and its textual description. Then, the query image can be treated as if it is a word. This enables the flexible and seamless composition of query image features and text descriptions by the language encoder. We call our method Pic2Word and provide an overview of its training process in the figure below. We want the mapped token s to represent the input image in the form of word token. Then, we train the mapping network to reconstruct the image embedding in the language embedding, p. Specifically, we optimize the contrastive loss proposed in CLIP computed between the visual embedding v and the textual embedding p.
Training of the mapping network (fM) using unlabeled images only. We optimize only the mapping network with a frozen visual and text encoder.
Given the trained mapping network, we can regard an image as a word token and pair it with the text description to flexibly compose the joint image-text query as shown in the figure below.
With the trained mapping network, we regard the image as a word token and pair it with the text description to flexibly compose the joint image-text query.
Evaluation
We conduct a variety of experiments to evaluate Pic2Word’s performance on a variety of CIR tasks.
Domain conversion
We first evaluate the capability of compositionality of the proposed method on domain conversion — given an image and the desired new image domain (e.g., sculpture, origami, cartoon, toy), the output of the system should be an image with the same content but in the new desired image domain or style. As illustrated below, we evaluate the ability to compose the category information and domain description given as an image and text, respectively. We evaluate the conversion from real images to four domains using ImageNet and ImageNet-R.
To compare with approaches that do not require supervised training data, we pick three approaches: (i) image only performs retrieval only with visual embedding, (ii) text only employs only text embedding, and (iii) image + text averages the visual and text embedding to compose the query. The comparison with (iii) shows the importance of composing image and text using a language encoder. We also compare with Combiner, which trains the CIR model on Fashion-IQ or CIRR.
We aim to convert the domain of the input query image into the one described with text, e.g., origami.
As shown in figure below, our proposed approach outperforms baselines by a large margin.
Results (recall@10, i.e., the percentage of relevant instances in the first 10 images retrieved.) on composed image retrieval for domain conversion.
Fashion attribute composition
Next, we evaluate the composition of fashion attributes, such as the color of cloth, logo, and length of sleeve, using the Fashion-IQ dataset. The figure below illustrates the desired output given the query.
Overview of CIR for fashion attributes.
In the figure below, we present a comparison with baselines, including supervised baselines that utilized triplets for training the CIR model: (i) CB uses the same architecture as our approach, (ii) CIRPLANT, ALTEMIS, MAAF use a smaller backbone, such as ResNet50. Comparison to these approaches will give us the understanding on how well our zero-shot approach performs on this task.
Although CB outperforms our approach, our method performs better than supervised baselines with smaller backbones. This result suggests that by utilizing a robust CLIP model, we can train a highly effective CIR model without requiring annotated triplets.
Results (recall@10, i.e., the percentage of relevant instances in the first 10 images retrieved.) on composed image retrieval for Fashion-IQ dataset (higher is better). Light blue bars train the model using triplets. Note that our approach performs on par with these supervised baselines with shallow (smaller) backbones.
Qualitative results
We show several examples in the figure below. Compared to a baseline method that does not require supervised training data (text + image feature averaging), our approach does a better job of correctly retrieving the target image.
Qualitative results on diverse query images and text description.
Conclusion and future work
In this article, we introduce Pic2Word, a method for mapping pictures to words for ZS-CIR. We propose to convert the image into a word token to achieve a CIR model using only an image-caption dataset. Through a variety of experiments, we verify the effectiveness of the trained model on diverse CIR tasks, indicating that training on an image-caption dataset can build a powerful CIR model. One potential future research direction is utilizing caption data to train the mapping network, although we use only image data in the present work.
Acknowledgements
This research was conducted by Kuniaki Saito, Kihyuk Sohn, Xiang Zhang, Chun-Liang Li, Chen-Yu Lee, Kate Saenko, and Tomas Pfister. Also thanks to Zizhao Zhang and Sergey Ioffe for their valuable feedback.
The latest release of NVIDIA CUDA Toolkit 12.2 introduces a range of essential new features, modifications to the programming model, and enhanced support for…
The latest release of NVIDIA CUDA Toolkit 12.2 introduces a range of essential new features, modifications to the programming model, and enhanced support for hardware capabilities accelerating CUDA applications.
Now out through general availability from NVIDIA, CUDA Toolkit 12.2 includes many new capabilities, both major and minor.
The following post offers an overview of many of the key capabilities, including:
NVIDIA Hopper (H100) GPU support.
Early access to NVIDIA Confidential Computing (CC) for Hopper GPUs.
Heterogeneous Memory Management (HMM) support.
A lazy loading default setting.
Application prioritization with CUDA Multi-Process Service (MPS).
Enhanced math libraries like cuFFT.
NVIDIA Nsight Compute and NVIDIA Nsight Systems Developer Tools updates.
As pioneers in accelerated computing, NVIDIA creates solutions for helping solve the world’s toughest computing challenges. Accelerated computing requires full-stack optimization, from chip architecture, systems, and acceleration libraries, to security and network connectivity. It all begins with the CUDA Toolkit.
Watch the following CUDA Toolkit 12.2 YouTube Premiere webinar.
Hopper GPU support
New H100 GPU architecture features are now supported with programming model enhancements for all GPUs, including new PTX instructions and exposure through higher-level C and C++ APIs. An instance of this is Hopper Confidential Computing (see the following section to learn more), which offers early access deployment exclusively available with the Hopper GPU architecture.
Confidential computing for Hopper
The Hopper Confidential Computing early-access software release features a complete software stack targeting a single H100 GPU in passthrough mode, with a single session key for encryption and authentication, and basic use of NVIDIA Developer Tools. User code and data is encrypted and authenticated to the AES-GCM standard.
There is no need for any specific H100 SKUs, drivers, or toolkit downloads. Confidential computing with H100 GPUs requires a CPU that supports virtual machine (VM)–based TEE technology, such as AMD SEV-SNP and Intel TDX.
The following figure compares data flow when using a VM when CC is on and off.
Figure 1. Comparing the flow of instructions and data with confidential computing on and off
In Figure 1, a traditional VM is set up on the left. In this mode, the hypervisor assigns an H100 GPU (without CC mode enabled). While the hypervisor is isolated and protected from a malicious VM, the reverse isn’t true: the hypervisor can access the entirety of the VM space as well as direct access to the GPU.
The right side of Figure 1 shows the same environment but on a confidential computing-capable machine. The CPU architecture isolates the now confidential virtual machine (CVM) from the hypervisor such that it can no longer access its memory pages. The H100 is also configured so all external accesses are disabled, except for the path between it and the CVM. The CVM and the H100 have encrypted and signed transfers across the PCIe bus, preventing an attacker with a bus analyzer from making use of, or silently corrupting the data.
While using the early-access release, employ good practices and test only synthetic data and non-proprietary AI models. Security reviews, performance enhancements, and audits aren’t finalized.
Hopper Confidential Computing does not include encryption key rotation at this time. To learn more, see the post What Is Confidential Computing?
Heterogeneous memory management
The release also introduces heterogeneous memory management (HMM). This technology extends unified virtual memory support for seamless sharing of data between host memory and accelerator devices without needing memory allocated by or managed through CUDA. This makes porting applications into CUDA, or working with external frameworks and APIs, significantly easier.
Currently, HMM is supported on Linux only and requires a recent kernel (6.1.24+ or 6.2.11+) along with using the NVIDIA GPU Open Kernel Modules driver.
Some limitations exist with the first release and the following are not yet supported:
GPU atomic operations on file-backed memory.
Arm CPUs.
HugeTLBfs pages on HMM.
The fork() system call when attempting to share GPU-accessible memory between parent and child processes.
HMM is also not yet fully optimized and may perform slower than programs using cudaMalloc(), cudaMallocManaged(), or other existing CUDA memory management APIs.
Lazy loading
A feature NVIDIA initially introduced in CUDA 11.7 as an opt-in, lazy loading is now enabled by default on Linux with the R535 driver and beyond. Lazy loading can substantially reduce both the host and device memory footprint by loading only CUDA kernels and library functions as needed. It’s common for complex libraries to contain thousands of different kernels and variants. This results in substantial savings.
Lazy loading is under user control and only the default value is changed. You can disable the feature on Linux by setting the environment variable before launching your application:
CUDA_MODULE_LOADING=EAGER
While disabling in Windows is currently unavailable, you can enable it in Windows by setting the environment variable before launch:
CUDA_MODULE_LOADING=LAZY
Application prioritization with CUDA MPS
When running applications with CUDA MPS, each application is often coded as the only application present in the system. As such, its individual stream priorities may assume no system-level contention. In practice, however, users often want to make certain processes a higher or lower priority globally.
To help address this requirement, a coarse-grained per-client priority mapping at runtime for CUDA MPS is now available. This gives multiple processes running under MPS to arbitrate priority at a coarse-grained level between multiple processes without changing the application code.
A new environment variable called CUDA_MPS_CLIENT_PRIORITY accepts two values: NORMAL priority, 0, and BELOW_NORMAL priority, 1.
For example, given two clients, a potential configuration is as follows:
Client 1 Environment
Client 2 Environment
export CUDA_MPS_CLIENT_PRIORITY=0 // NORMAL
export CUDA_MPS_CLIENT_PRIORITY=1 // BELOW NORMAL
Table 1. An example configuration for setting priority variables
It’s worth noting that this doesn’t introduce priority-preemptive scheduling or hard real-time processing into the GPU scheduler. It does provide additional information to the scheduler about which kernels should enqueue when.
cuFFT LTO preview
An early access preview of the cuFFT library containing support for new and enhanced LTO-enabled callback routines is now available for download on Linux and Windows. LTO-enabled callbacks bring callback support for cuFFT on Windows for the first time. On Linux, these new enhanced callbacks offer a significant boost to performance in many callback use cases. You can learn more and download this new update on the cuFFT web page.
In CUDA 12.0, NVIDIA introduced the nvJitLink library for supporting Just-In-Time Link-Time Optimization (JIT LTO) in CUDA applications. This preview builds upon nvJitLink to leverage JIT LTO for LTO-enabled callbacks by enabling runtime fusion of user callback code and library kernel code.
Nsight Developer Tools
Nsight Developer Tools are included in the CUDA Toolkit to help with debugging and performance profiling for CUDA applications. Tools for GPU development are already compatible with the H100 architecture. Support for the NVIDIA Grace CPU architecture is now available in Nsight Systems, for system-wide performance profiling.
Nsight Systems traces and analyzes platform hardware metrics, like CPU and GPU interactions, as well CUDA apps, APIs, and libraries on a unified timeline. Version 2023.2, available in CUDA Toolkit 12.2, introduces Python backtrace sampling.
GPU-accelerated Python is transforming AI workloads. With a periodic sampling of Python code, the Nsight Systems timeline offers a deeper understanding of what algorithms are involved in refactoring toward maximum GPU usage. Python sampling joins multi-node analysis and network metric collection to help optimize computing at the data center scale; learn more about accelerating data center and HPC performance analysis with Nsight Systems.
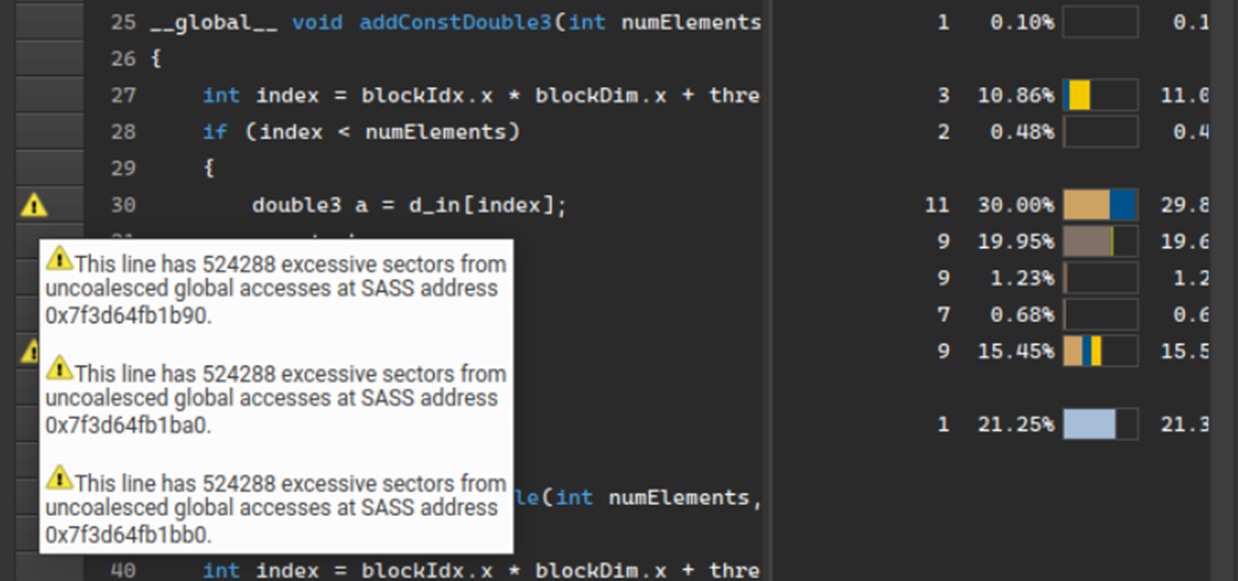
Nsight Compute provides detailed performance profiling and analysis of CUDA kernels running on a GPU. Version 2023.2 adds a new sorted list of detected performance issues on the summary page, including estimated speedups for correcting the issue. This list guides performance tuning focus and helps users avoid spending time on unnecessary issues.
Another key feature added is performance rule markers at the source-line level on the source page. Previously, issues detected with the built-in performance rules were only displayed on the details page. Now, issues are marked with a warning icon on the source page. Performance metrics identify the location.
Figure 3. Examine performance issues line-by-line in the source code viewe
These new features extend the guided analysis at both the high-level summary view and low-level source view, further improving Nsight Compute performance profiling and analysis capabilities.
CUDA Toolkit 12.2 also equips you with the latest debugging tools. These include:
The latest CUDA Toolkit release introduces new features essential to boosting CUDA applications that create the foundation for accelerated computing applications. From chip architecture, NVIDIA DGX Cloud and NVIDIA DGX SuperPOD platforms, AI Enterprise software, and libraries, to security and accelerated network connectivity, the CUDA Toolkit offers incomparable full-stack optimization.
Do you still have questions? Register now to join our CUDA experts in a special AMA covering everything featured in CUDA 12 on July 26, 2023: https://nvda.ws/3XEcy2m.
In MLPerf Inference v3.0, NVIDIA made its first submissions to the newly introduced Network division, which is now part of the MLPerf Inference Datacenter…
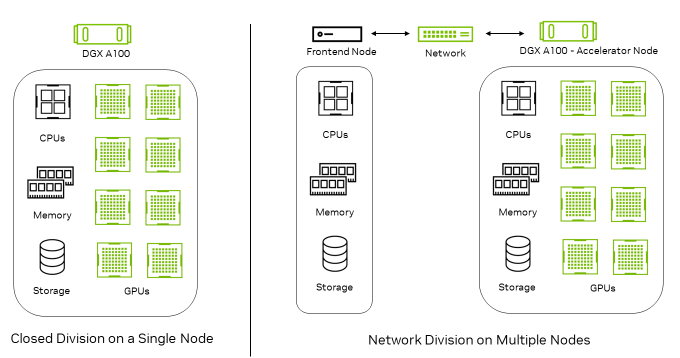
In MLPerf Inference v3.0, NVIDIA made its first submissions to the newly introduced Network division, which is now part of the MLPerf Inference Datacenter suite. The Network division is designed to simulate a real data center setup and strives to include the effect of networking—including both hardware and software—in end-to-end inference performance.
In the Network division, there are two types of nodes: Frontend nodes generate the queries, which are sent over the network to be processed by the Accelerator nodes, which perform inference. These are connected through standard network fabrics such as Ethernet or InfiniBand.
Figure 1. Closed division vs. Network divisionnodes
Figure 1 shows that the Closed division runs entirely on a single node. In the Network division, queries are generated on the Frontend node and transferred to the Accelerator node for inferencing.
In the Network division, the Accelerator nodes incorporate the inference accelerators as well as all networking components. This includes the network interface controller (NIC), network switch, and network fabric. So, while the Network division seeks to measure the performance of the Accelerator node and network, it excludes the impact of the Frontend node as the latter plays a limited role in the benchmarking.
NVIDIA performance in the MLPerf Inference v3.0 Network division
In MLPerf Inference v3.0, NVIDIA made Network division submissions on both the ResNet-50 and BERT workloads. The NVIDIA submissions achieved 100% of single-node performance on ResNet-50 by using the extremely high network bandwidth and low latency of GPUDirect RDMA technology on NVIDIA ConnectX-6 InfiniBand smart adapter cards.
Benchmark
DGX A100 (8x A100 80GB)
Performance of the Network division compared to the Closed division
ResNet-50 (Low Accuracy)
Offline
100%
Server
100%
BERT (Low Accuracy)
Offline
94%
Server
96%
BERT (High Accuracy)
Offline
90%
Server
96%
Table 1. ResNet-50 and BERT performance achieved in the Network division compared to the Closed division, with minimum network bandwidth required to sustain the achieved performance
The NVIDIA platform also showcased great performance on the BERT workload, with only a slight performance impact relative to the corresponding Closed division submission observed due to host-side batching overhead.
Technologies used in the NVIDIA Network division submission
A host of full-stack technologies enabled the strong NVIDIA Network division performance:
A NVIDIA TensorRT backend for the optimized inference engine
Here’s a closer look at the implementation details of the MLPerf Inference Network division:
InfiniBand for high-throughput, low-latency communication
Network division inference flow
Performance optimizations
InfiniBand for high-throughput, low-latency communication
The Network division requires the submitter to implement a query dispatch library (QDL) that takes the queries from the load generator and dispatches them to the Accelerator nodes in a way suited to the submitter’s setup.
In the Frontend node, where the input tensor sequence is generated, the QDL abstracts the LoadGen system under the test (SUT) API to make it appear to the MLPerf Inference LoadGen that the accelerators are available to test locally.
In the Accelerator node, the QDL makes it appear that it interacts with LoadGen for inference requests and responses directly. Within the QDL implementation by NVIDIA, we implement seamless data communication and synchronization using InfiniBand IBV verbs and an Ethernet TCP socket.
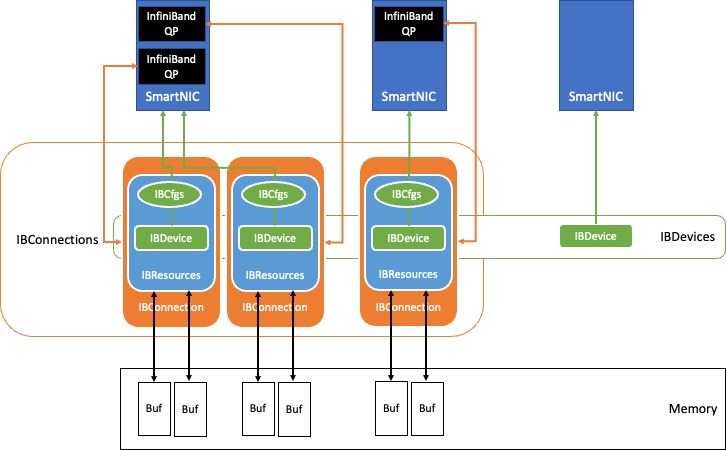
Figure 2. InfiniBand data exchange component inside the QDL
Figure 2 shows the data exchange component built in the QDL with InfiniBand technology.
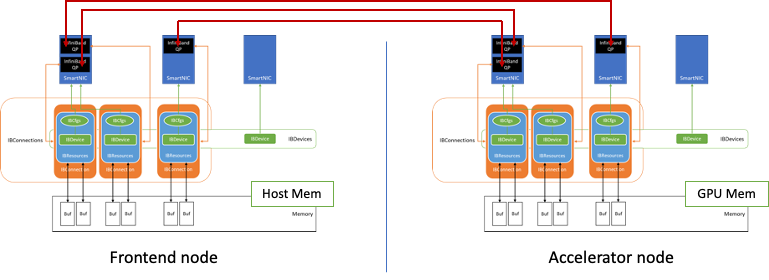
Figure 3. Example connection established between the Frontend and Accelerator nodes
Figure 3 shows how connections are established between two nodes using this data exchange component.
InfiniBand queue pairs (QPs) are the basic connection point between the nodes. The NVIDIA implementation uses the lossless reliable connection (RC), which is similar to TCP, and transfer mode, while relying on an InfiniBand HDR optical fabric solution to sustain up to 200 Gbits/sec throughput.
When the benchmarking begins, the QDL initialization discovers the InfiniBand NICs available in the system. Following the configuration stored in IBCfgs, the NICs designated for use are populated as IBDevice instances. During this population, memory regions for RDMA transfers are allocated, pinned, and registered as RDMA buffers and kept in IBResources, together with proper handles.
RDMA buffers of the Accelerator node reside in GPU memory to leverage GPUDirect RDMA. The RDMA buffer information, as well as the proper protection keys, are then communicated with the peer node through a TCP socket over Ethernet. This creates the IBConnection instance for the QDL.
The QDL implementation is NUMA-aware and maps the closest NUMA host memory, CPUs, and GPUs to each NIC. Each NIC uses the IBConnection to talk to a peer’s NIC.
Network division inference flow
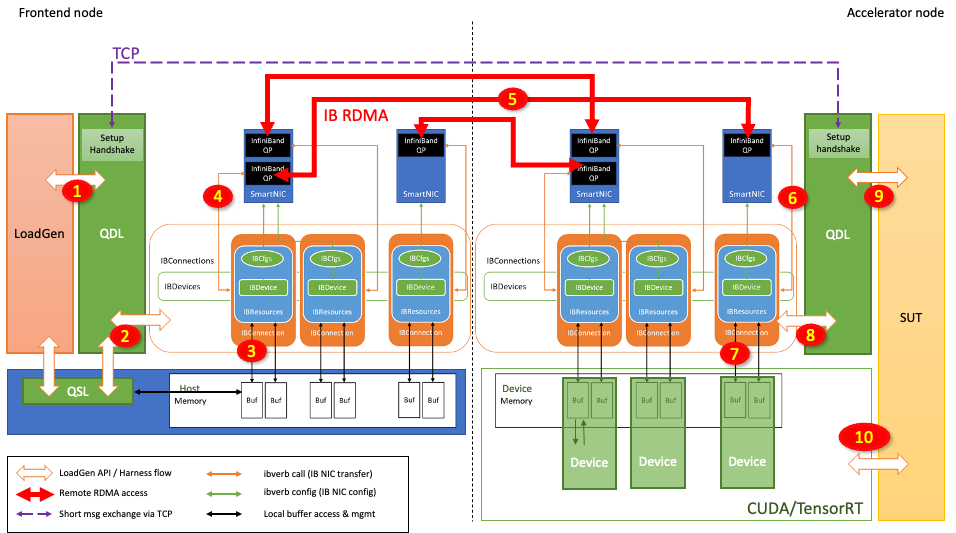
Figure 4. Inference request flow from Frontend node to Accelerator node using DirectGPU RDMA
Figure 4 shows how the inference request is sent from the Frontend node and processed at the Accelerator node:
LoadGen generates a query (inference request), which contains input tensors.
The QDL redirects this query to the appropriate IBConnection based on the arbitration scheme.
The query sample library (QSL) may be already registered within the RDMA buffer. If not, the QDL stages (copies) the query to the RDMA buffer.
QDL initiates the RDMA transfer with the associated QP.
The InfiniBand network transfer happens through the network switch.
The query arrives at the peer’s QP.
The query is then transferred to the destination RDMA buffer through Direct Memory Access.
RDMA completion is acknowledged in the Accelerator node QDL.
The QDL enables the Accelerator node to batch this query. The QDL tags the batch of queries to be issued to one of the Accelerator node’s accelerators.
The Accelerator node’s accelerator performs inference using CUDA and TensorRT and produces a response in the RDMA buffer.
When the inference is ultimately performed as in step 10, the output tensors are generated and populated in the RDMA buffer. Then the Accelerator node starts transferring the response tensors to the Frontend node in a similar fashion but in the opposite direction.
Performance optimizations
The NVIDIA implementation uses InfiniBand RDMA Write and takes advantage of the shortest latency. For the RDMA Write to happen successfully, the sender must explicitly manage target memory buffers.
Both Frontend and Accelerator nodes manage buffer trackers to make sure that each query and response is kept in memory until consumed. As an example, ResNet-50 requires that up to 8K transactions be managed per connection (QP) to sustain the performance.
Some of the following key optimizations are included in the NVIDIA implementation.
The following key optimizations support better scalability:
Transaction tracker per IBConnection (QP): Each IBConnection has an isolated transaction tracker resulting in lock-free, intra-connection transaction bookkeeping.
Multiple QP support per NIC: An arbitrary number of IBConnections can be instantiated on any NIC, making it easy to support a large number of transactions spontaneously.
The following key optimizations improve InfiniBand resource efficiency:
Use of INLINE transfer for small messages: Transferring small messages (typically less than 64 bytes) through INLINE transfer significantly improves performance and efficiency by avoiding PCIe transfers.
Use of UNSIGNALLED RDMA Write: CQ maintenance becomes much more efficient as UNSIGNALLED transactions wait in CQ until SIGNALLED transaction happens, triggering completion handling of all transactions queued up so far (bulk completion) in the same node.
Use of solicited IB transfers: Unsolicited RDAM transactions may queue up in the remote node until a solicited RDMA transaction happens, triggering bulk completion in the remote node.
Event-based CQ management: Avoiding busy waiting for CQ management frees up CPU cycles.
The following key optimizations improve memory system efficiency:
RDMA transfer without staging in Frontend node: When sending input tensors, avoid host memory copies by populating input tensors in the RDMA registered memory.
Aggregating (CUDA) memcpys in Accelerator node: Improve the efficiency of GPU memory copies and PCIe transfers by gathering tensors in the consecutive memory as much as possible.
Each vendor’s QP implementation details the maximum number of completion queue entries (CQEs) supported, as well as the supported maximum QP entry sizes. It’s important to scale the number of QPs per NIC to cover the latency while sustaining enough transactions on-the-fly to achieve maximum throughput.
Host CPUs can also be stressed significantly if an extremely large number of transactions are handled in a short time from CQ by polling. Event-based CQ management, together with a reduction in the number of notifications, helps greatly in this case. Maximize the memory access efficiency by aggregating data in contiguous space as much as possible and, if possible, in the RDMA registered memory space. This is crucial to achieving maximum performance.
Summary
The NVIDIA platform delivered exceptional performance in its inaugural Network division submission on top of our continued performance leadership in the MLPerf Inference: Datacenter Closed division. These results were achieved using many NVIDIA platform capabilities:
The results provide a further demonstration of the performance and versatility of the NVIDIA AI platform in real data center deployments on industry-standard, peer-reviewed benchmarks.
GFN Thursday arrives alongside the sweet Steam Summer Sale — with hundreds of PC games playable on GeForce NOW available during Valve’s special event for PC gamers. Also on sale, OCTOPATH TRAVELER and OCTOPATH TRAVELER II join the GeForce NOW library as a part of five new games coming to the service this week. Saved Read article >

 If you are a DirectX 12 (DX12) game developer, you may have noticed that GPU times displayed in real time in your game HUD may change over time for a given…
.jpg)
 Robotics simulation enables virtual training and programming that can use physics-based digital representations of environments, robots, machines, objects, and…


 Organizations are increasingly adopting hybrid and multi-cloud strategies to access the latest compute resources, consistently support worldwide customers, and…
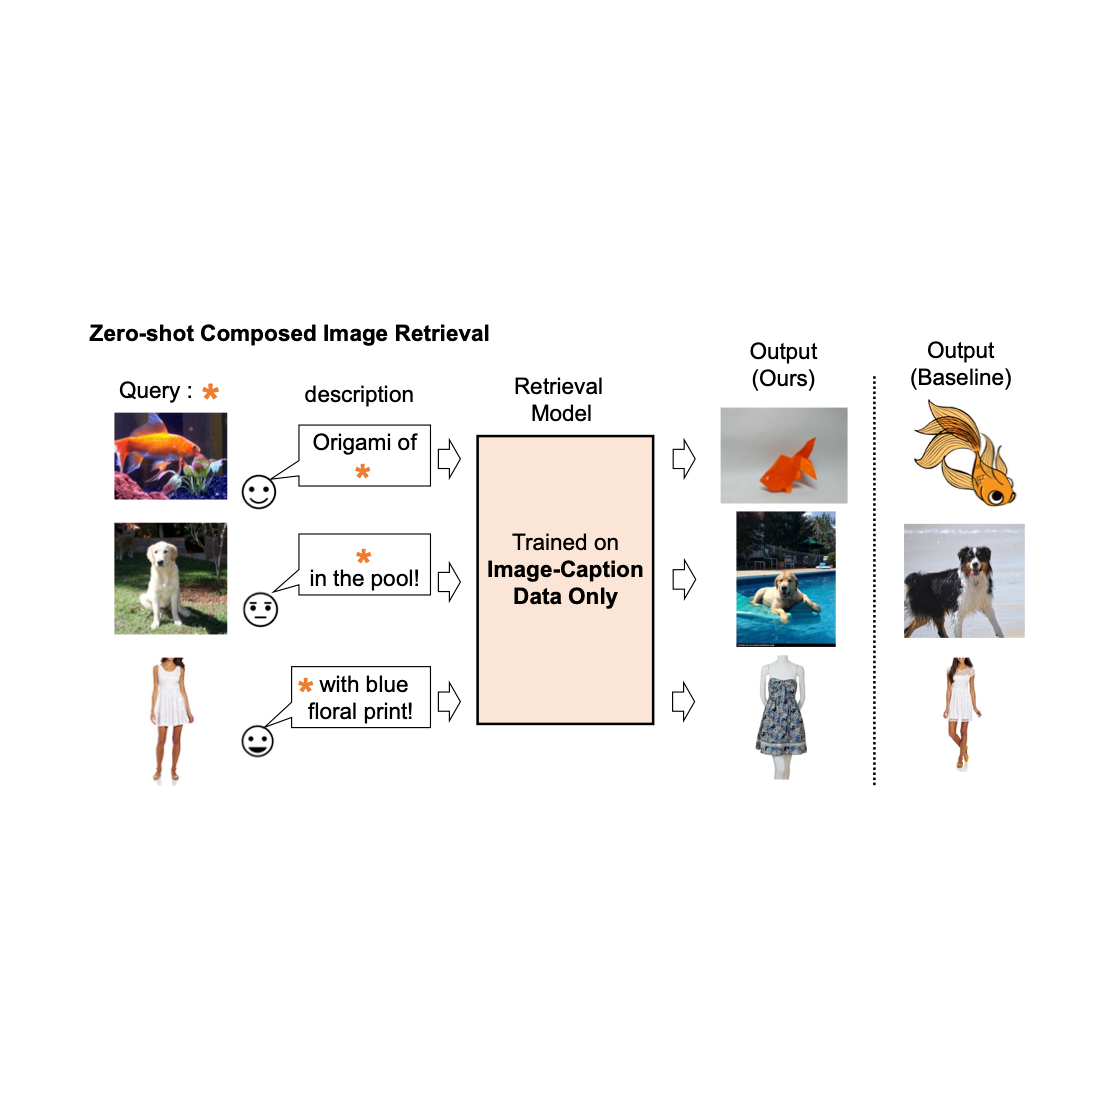


 The latest release of NVIDIA CUDA Toolkit 12.2 introduces a range of essential new features, modifications to the programming model, and enhanced support for…
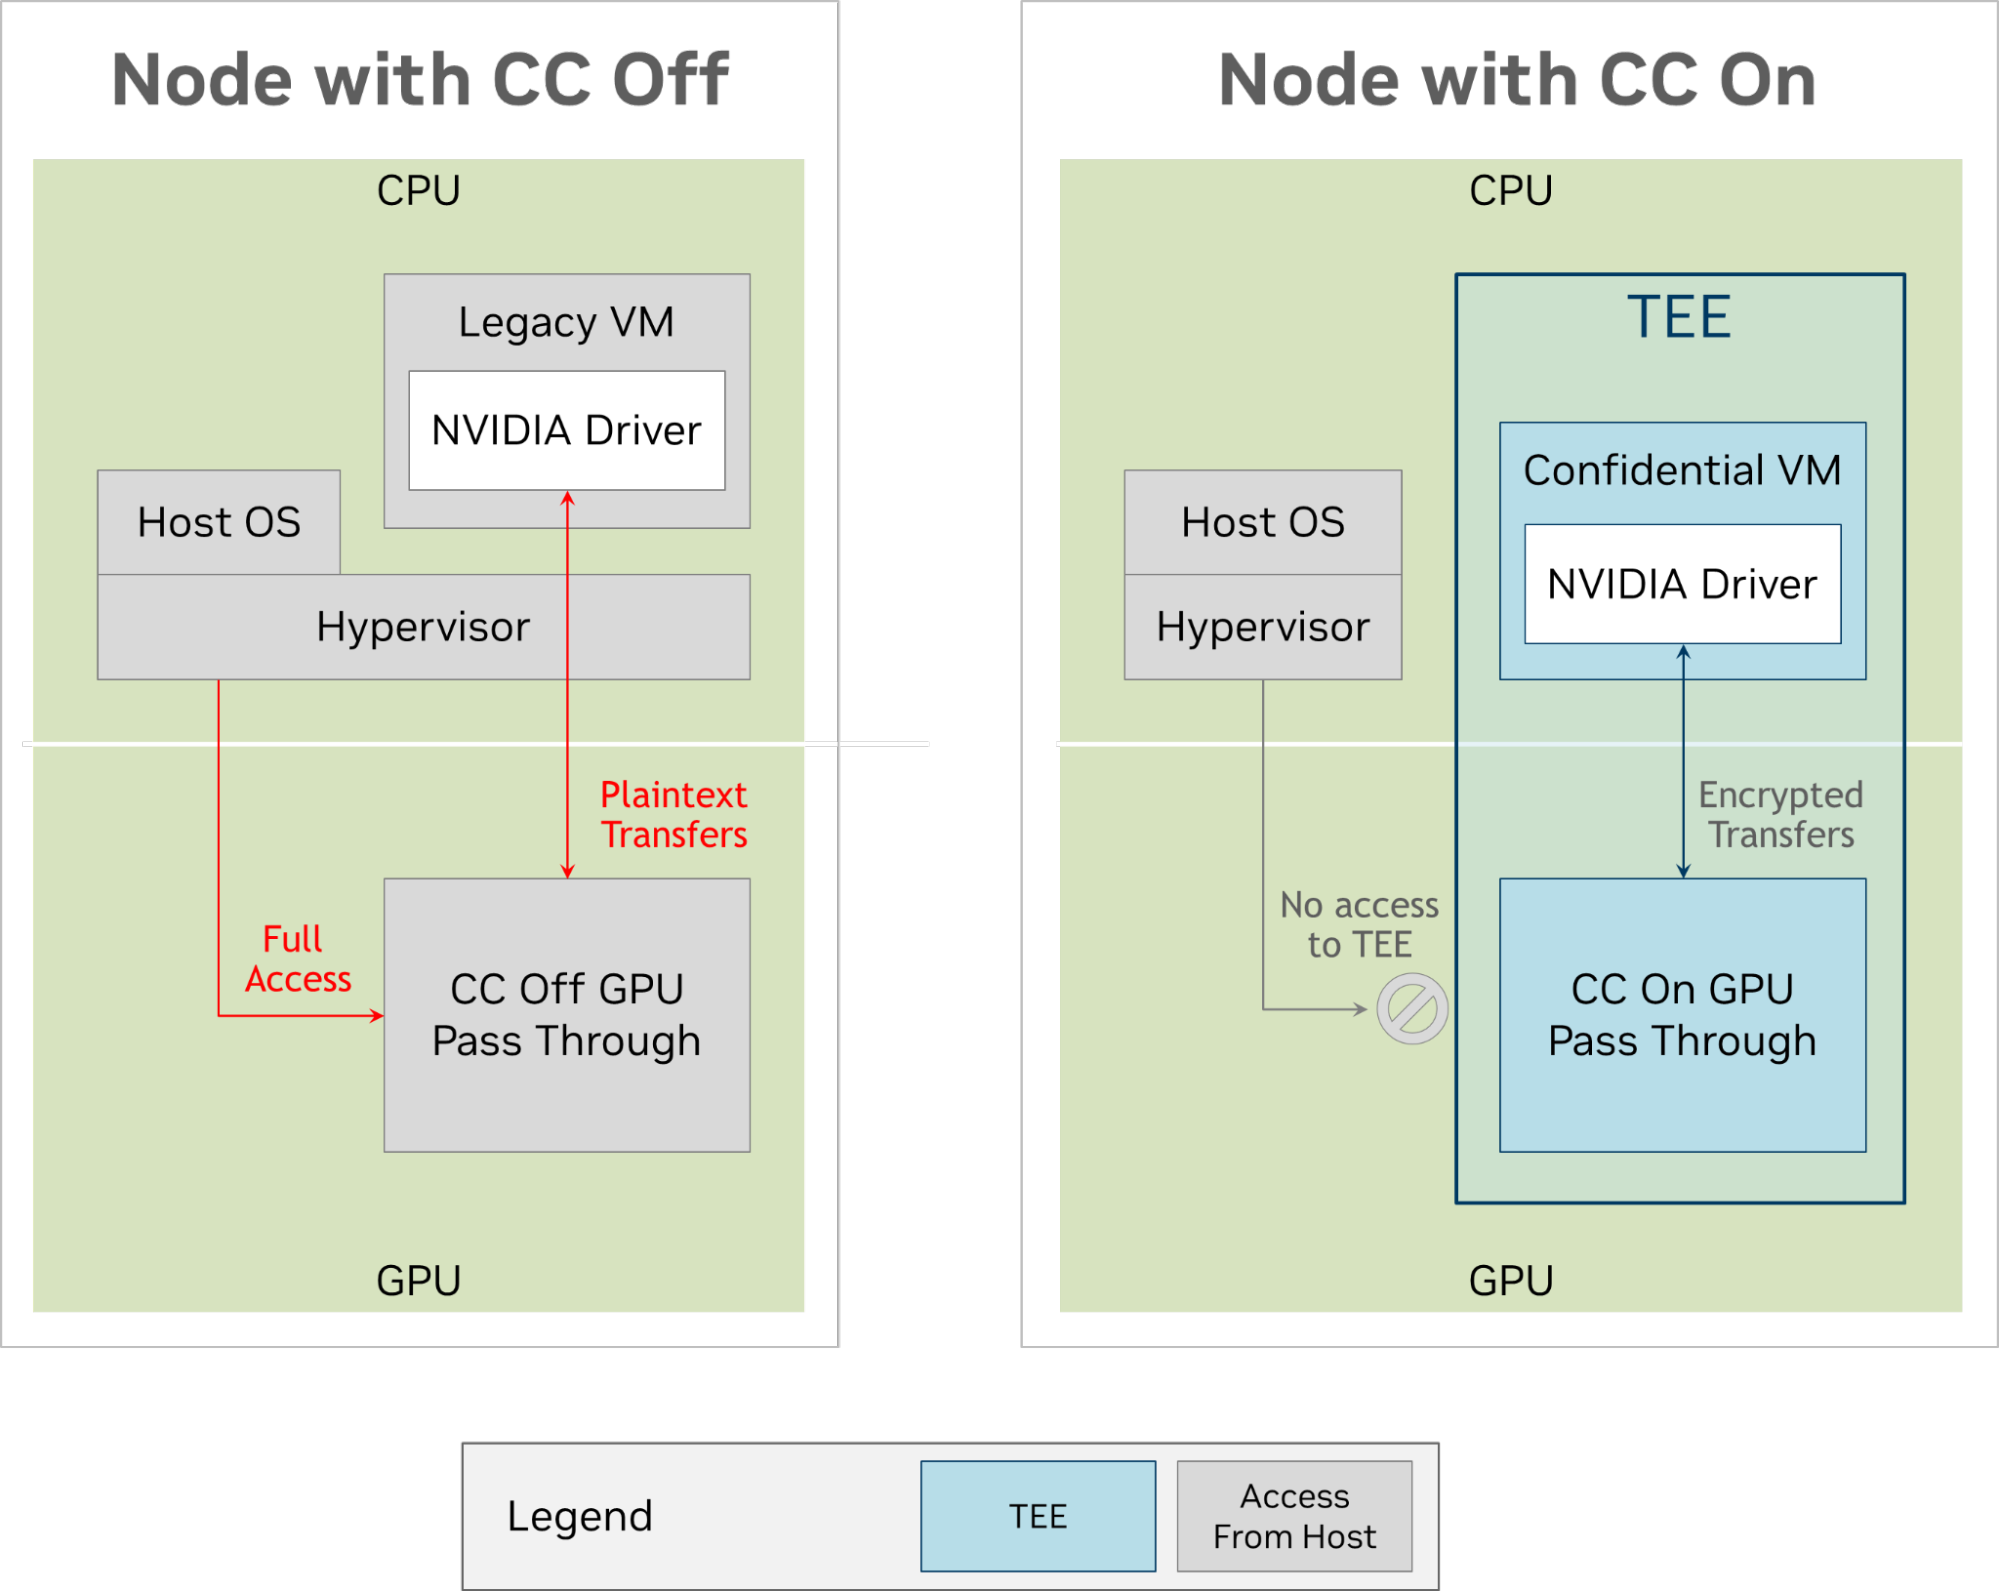
 In MLPerf Inference v3.0, NVIDIA made its first submissions to the newly introduced Network division, which is now part of the MLPerf Inference Datacenter…