Optical Character Detection (OCD) and Optical Character Recognition (OCR) are computer vision techniques used to extract text from images. Use cases vary across…
Optical Character Detection (OCD) and Optical Character Recognition (OCR) are computer vision techniques used to extract text from images. Use cases vary across industries and include extracting data from scanned documents or forms with handwritten texts, automatically recognizing license plates, sorting boxes or objects in a fulfillment center based on serial numbers, identifying components for inspection on assembly lines based on part numbers, and more.
OCR is used in many industries, including financial services, healthcare, logistics, industrial inspection, and smart cities. OCR improves productivity and increases operational efficiency for businesses by automating manual tasks.
To be effective, OCR must achieve or exceed human-level accuracy. It is inherently complicated due to the unique use cases it works across. For example, when OCR is analyzing text, the text can vary in font, size, color, shape, and orientation, and can be handwritten or have other noise like partial occlusion. Fine-tuning the model on the test environment becomes extremely important to maintain high accuracy and reduce error rate.
NVIDIA TAO Toolkit is a low-code AI toolkit that can help developers customize and optimize models for many vision AI applications. NVIDIA introduced new models and features for automating character detection and recognition in TAO 5.0. These models and features will accelerate the creation of custom OCR solutions. For more details, see Access the Latest in Vision AI Model Development Workflows with NVIDIA TAO Toolkit 5.0.
This post is part of a series on using NVIDIA TAO and pretrained models to create and deploy custom AI models to accurately detect and recognize handwritten texts. This part explains the training and fine-tuning of character detection and recognition models using TAO. Part 2 walks you through the steps to deploy the model using NVIDIA Triton. The steps presented can be used with any other OCR tasks.
NVIDIA TAO OCD/OCR workflow
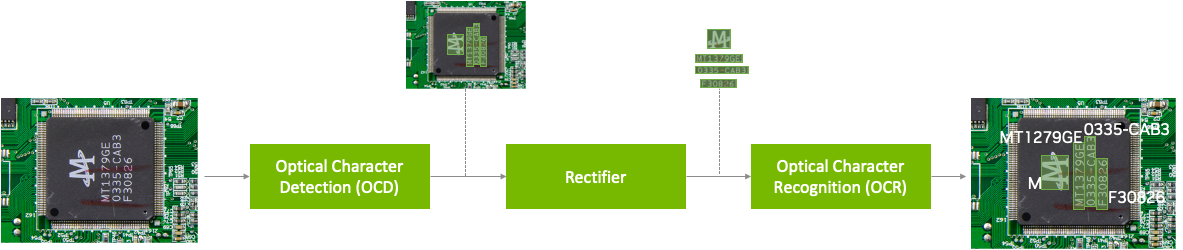
A pretrained model has been trained on large datasets and can be further fine-tuned with additional data to accomplish a specific task. The Optical Character Detection Network (OCDNet) is a TAO pretrained model that detects text in images with complex backgrounds. It uses a process called differentiable binarization to help accurately locate text of various shapes, sizes, and fonts. The result is a bounding box with the detected text.
A text rectifier is middleware that serves as a bridge between character detection and character recognition during the inference phase. Its primary function is to improve the accuracy of recognizing characters on texts that are at extreme angles. To achieve this, the text rectifier takes the vertices of polygons that cover the text area and the original images as inputs.
The Optical Character Recognition Network (OCRNet) is another TAO pretrained model that can be used to recognize the characters of text that reside in the detected bounding box regions. This model takes the image as network input and produces a sequence of characters as output.
Prerequisites
To follow along with the tutorial, you will need the following:
- An NGC account
- The sample Jupyter notebook for training an OCD and OCR model.
- NVIDIA TAO Toolkit 5.0 (Installation instructions are included in the Jupyter notebooks). For a complete set of dependencies and prerequisites, see the TAO Toolkit Quick Start Guide.
Download the dataset
This tutorial fine-tunes the OCD and OCR model to detect and recognize handwritten letters. It works with the IAM Handwriting Database, a large dataset containing various handwritten English text documents. These text samples will be used to train and test handwritten text recognizers for the OCD and OCR models.
To gain access to this dataset, register your email address on the IAM registration page.
Once registered, download the following datasets from the downloads page:
- data/ascii.tgz
- data/formsA-D.tgz
- data/formsE-H.tgz
- data/formsI-Z.tgz
The following section explores various aspects of the Jupyter notebook to delve deeper into the fine-tuning process of OCDNet and OCRNet for the purpose of detecting and recognizing handwritten characters.
Note that this dataset may be used for noncommercial research purposes only. For more details, review the terms of use on the IAM Handwriting Database.
Run the notebook
The OCDR Jupyter notebook showcases how to fine-tune the OCD and OCR models to the IAM handwritten dataset. It also shows how to run inference on the trained models and perform deployment.
Set up environment variables
Set up the following environment variables in the Jupyter notebook to match your current directory, then execute:
%env LOCAL_PROJECT_DIR=home//ocdr_notebook
%env NOTEBOOK_DIR=home//ocdr_notebook

# Set this path if you don't run the notebook from the samples directory.
%env NOTEBOOK_ROOT=home//ocdr_notebook
The following folders will be generated:
- HOST_DATA_DIR contains the train/test split data for model training.
- HOST_SPECS_DIR houses the specification files that contain the hyperparameters used by TAO to perform training, inference, evaluation, and model deployment.
- HOST_RESULTS_DIR contains the results of the fine-tuned OCD and OCR models.
- PRE_DATA_DIR is where the downloaded handwritten dataset files will be located. This path will be called to preprocess the data for OCD/OCR model training.
TAO Launcher uses Docker containers when running tasks. For data and results to be visible to Docker, map the location of our local folders to the Docker container using the ~/.tao_mounts.json file. Run the cell in the Jupyter notebook to generate the ~/.tao_mounts.json file.
The environment is now ready for use with the TAO Launcher. The next steps will prepare the handwritten dataset to be in the correct format for TAO OCD model training.
Prepare the dataset for OCD and OCR
Preprocess the IAM handwritten dataset to match the TAO image format following the steps below. Note that in the folder structure for OCD and OCR model training in TAO, /img houses the handwritten image data, and /gt contains ground truth labels of the characters found in each image.
|── train
|   ├──img
|   ├──gt
|── test
|   ├──img
|   ├──gt
Begin by moving the four downloaded .tgz files to the location of your $PRE_DATA_DIR directory. If you are following the same steps as above, the .tgz files will be placed in /data/iamdata.
Extract the images and ground truth labels from these files. The subsequent cells will extract the image files and move them to the proper folder format when run.
!tar -xf $PRE_DATA_DIR/ascii.tgz --directory $PRE_DATA_DIR/ words.txt

# Create directories to hold the image data and ground truth files.
!mkdir -p $PRE_DATA_DIR/train/img
!mkdir -p $PRE_DATA_DIR/test/img
!mkdir -p $PRE_DATA_DIR/train/gt
!mkdir -p $PRE_DATA_DIR/test/gt
# Unpack the images, let's use the first two groups of images for training, and the last for validation.

!tar -xzf $PRE_DATA_DIR/formsA-D.tgz --directory $PRE_DATA_DIR/train/img
!tar -xzf $PRE_DATA_DIR/formsE-H.tgz --directory $PRE_DATA_DIR/train/img
!tar -xzf $PRE_DATA_DIR/formsI-Z.tgz --directory $PRE_DATA_DIR/test/img
The data is now organized correctly. However, the ground truth label used by IAM dataset is currently in the following format:
a01-000u-00-00 ok 154 1 408 768 27 51 AT A


#     a01-000u-00-00  -> word id for line 00 in form a01-000u
#     ok              -> result of word segmentation
#                            ok: word was correctly
#                            er: segmentation of word can be bad
#
#     154            -> graylevel to binarize the line containing this word
#     1               -> number of components for this word
#     408 768 27 51   -> bounding box around this word in x,y,w,h format
#     AT            -> the grammatical tag for this word, see the
#                        file tagset.txt for an explanation
#     A               -> the transcription for this word
The words.txt file looks like this:
  		0				1
0	a01-000u-00-00	ok 154 408 768 27 51 AT A
1	a01-000u-00-01	ok 154 507 766 213 48 NN MOVE
2	a01-000u-00-02	ok 154 796 764 70 50 TO to
...
Currently, words.txt uses a four-point coordinate system for drawing a bounding box around the word in an image. TAO requires the use of an eight-point coordinate system to draw a bounding box around detected text.
To convert the data to the eight-point coordinate system, use the extract_columns and process_text_file functions provided in section 2.1 of the notebook. words.txt will be transformed into the following DataFrame and will be ready for fine-tuning on an OCDNet model.
filename	   x	 y	x2	y2	x3	y3	x4	y4	word
0	gt_a01-000u.txt	  408	768	435	768	435	819	408	819	A
1	gt_a01-000u.txt	  507	766	720	766	720	814	507	814	MOVE
2	gt_a01-000u.txt	  796	764	866	764	866	814	796	814	to
...
To prepare the dataset for OCRNet, the raw image data and labels must be converted to LMDB format, which converts the images and labels into a key-value memory database.
# Convert the raw train and test dataset to lmdb
print("Converting the training set to LMDB.")
!tao model ocrnet dataset_convert -e $SPECS_DIR/ocr/experiment.yaml
                        	dataset_convert.input_img_dir=$DATA_DIR/train/processed
                        	dataset_convert.gt_file=$DATA_DIR/train/gt.txt
                        	dataset_convert.results_dir=$DATA_DIR/train/lmdb

# Convert the raw test dataset to lmdb
print("Converting the testing set to LMDB.")
!tao model ocrnet dataset_convert -e $SPECS_DIR/ocr/experiment.yaml
                        	dataset_convert.input_img_dir=$DATA_DIR/test/processed
                        	dataset_convert.gt_file=$DATA_DIR/test/gt.txt
                        	dataset_convert.results_dir=$DATA_DIR/test/lmdb
The data is now processed and ready to be fine-tuned on the OCDNet and OCRNet pretrained models.
Create a custom character detection (OCD) model
The NGC CLI will be used to download the pretrained OCDNet model. For more information, visit NGC and click on Setup in the navigation bar.
Download the OCDNet pretrained model
!mkdir -p $HOST_RESULTS_DIR/pretrained_ocdnet/

# Pulls pretrained models from NGC
!ngc registry model download-version nvidia/tao/ocdnet:trainable_resnet18_v1.0 --dest $HOST_RESULTS_DIR/pretrained_ocdnet/
You can check that the model has been downloaded to /pretrained_ocdnet/ using the following call:
print("Check that model is downloaded into dir.")
!ls -l $HOST_RESULTS_DIR/pretrained_ocdnet/ocdnet_vtrainable_resnet18_v1.0
OCD training specification
In the specs folder, you can find different files related to how you want to train, evaluate, infer, and export data for both models. For training OCDNet, you will use the train.yaml file in the specs/ocd folder. You can experiment with changing different hyperparameters, such as number of epochs, in this spec file.
Below is a code example of some of the configs that you can experiment with:
num_gpus: 1

model:
  load_pruned_graph: False
  pruned_graph_path: '/results/prune/pruned_0.1.pth'
  pretrained_model_path: '/data/ocdnet/ocdnet_deformable_resnet18.pth'
  backbone: deformable_resnet18

train:
  results_dir: /results/train
  num_epochs: 300
  checkpoint_interval: 1
  validation_interval: 1
...
Train the character detection model
Now that the specification files are configured, provide the paths to the spec file, the pretrained model, and the results:
#Train using TAO Launcher
#print("Run training with ngc pretrained model.")
!tao model ocdnet train
      	-e $SPECS_DIR/train.yaml
      	-r $RESULTS_DIR/train
      	model.pretrained_model_path=$DATA_DIR/ocdnet_deformable_resnet18.pth
Training output will resemble the following. Note that this step could take some time, depending on the number of epochs specified in train.yaml.
LOCAL_RANK: 0 - CUDA_VISIBLE_DEVICES: [0]
  | Name  | Type  | Params
--------------------------------
0 | model | Model | 12.8 M
--------------------------------
12.8 M    Trainable params
0         Non-trainable params
12.8 M    Total params
51.106    Total estimated model params size (MB)
Training: 0it [00:00, ?it/s]Starting Training Loop.
Epoch 0: 100%|█████████| 751/751 [19:57
Evaluate the model
Next, evaluate the OCDNet model trained on the IAM dataset.
# Evaluate on model
!tao model ocdnet evaluate
        	-e $SPECS_DIR/evaluate.yaml
        	evaluate.checkpoint=$RESULTS_DIR/train/model_best.pth
Evaluation output will look like the following:
test model: 100%|██████████████████████████████| 488/488 [06:44OCD inference
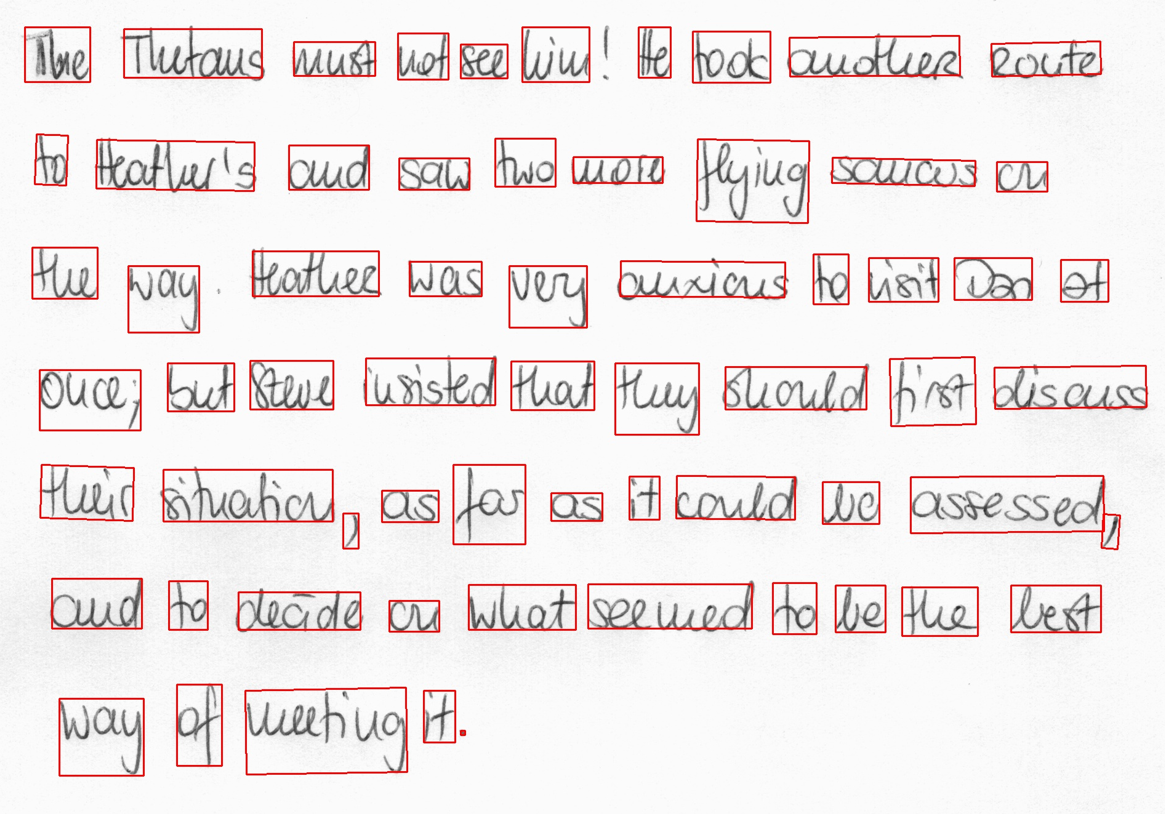
The inference tool produces annotated image outputs and .txt files that contain prediction information. Run the inference tool below to generate inferences on OCDNet models and visualize the results for detected text.
# Run inference using TAO
!tao model ocdnet inference
       	-e $SPECS_DIR/ocd/inference.yaml
       	inference.checkpoint=$RESULTS_DIR/ocd/train/model_best.pth
       	inference.input_folder=$DATA_DIR/test/img
       	inference.results_dir=$RESULTS_DIR/ocd/inference
Figure 3 shows the OCDNet inference on a test sample image.
Export the OCD model for deployment
The last step is to export the OCD model to ONNX format for deployment.
!tao model ocdnet export
       	-e $SPECS_DIR/export.yaml
       	export.checkpoint=$RESULTS_DIR/train/model_best.pth
       	export.onnx_file=$RESULTS_DIR/export/model_best.onnx
Create a custom character recognition (OCR) model
Now that you have the trained OCDNet model to detect and apply bounding boxes to areas of handwritten text, use TAO to fine-tune the OCRNet model to recognize and classify the detected letters.
Download the OCRNet pretrained model
Continuing in the Jupyter notebook, the OCRNet pretrained model will be pulled from NGC CLI.
!mkdir -p $HOST_RESULTS_DIR/pretrained_ocrnet/

# Pull pretrained model from NGC
!ngc registry model download-version nvidia/tao/ocrnet:trainable_v1.0 --dest $HOST_RESULTS_DIR/pretrained_ocrnet
OCR training specification
OCRNet will use the experiment.yaml spec file to perform training. You can change training hyperparameters such as batch size, number of epochs, and learning rate shown below:
dataset:
  train_dataset_dir: []
  val_dataset_dir: /data/test/lmdb
  character_list_file: /data/character_list
  max_label_length: 25
  batch_size: 32
  workers: 4

train:
  seed: 1111
  gpu_ids: [0]
  optim:
	name: "adadelta"
	lr: 0.1
  clip_grad_norm: 5.0
  num_epochs: 10
  checkpoint_interval: 2
  validation_interval: 1
Train the character recognition model
Train the OCRNet model on the dataset. You can also configure spec parameters like the number of epochs or learning rate within the train command, shown below.
!tao model ocrnet train -e $SPECS_DIR/ocr/experiment.yaml
          	train.results_dir=$RESULTS_DIR/ocr/train
          	train.pretrained_model_path=$RESULTS_DIR/pretrained_ocrnet/ocrnet_vtrainable_v1.0/ocrnet_resnet50.pth
          	train.num_epochs=20
          	train.optim.lr=1.0
          	dataset.train_dataset_dir=[$DATA_DIR/train/lmdb]
          	dataset.val_dataset_dir=$DATA_DIR/test/lmdb
          	dataset.character_list_file=$DATA_DIR/train/character_list.txt
The output will resemble the following:
...
Epoch 19: 100%|█| 3605/3605 [08:04
Evaluate the model
You can evaluate the OCRNet model based on the accuracy of its character recognition. Recognition accuracy simply means a percentage of all the characters in a text area that were recognized correctly.
!tao model ocrnet evaluate -e $SPECS_DIR/ocr/experiment.yaml
             	evaluate.results_dir=$RESULTS_DIR/ocr/evaluate
             	evaluate.checkpoint=$RESULTS_DIR/ocr/train/best_accuracy.pth
             	evaluate.test_dataset_dir=$DATA_DIR/test/lmdb
             	dataset.character_list_file=$DATA_DIR/train/character_list.txt
Evaluation
The output should appear similar to the following:
data directory:	/data/iamdata/test/lmdb	 num samples: 37109
Accuracy: 77.8%
OCR inference
Inference on OCR will produce a sequence output of recognized characters from the bounding boxes, shown below.
!tao model ocrnet inference -e $SPECS_DIR/ocr/experiment.yaml
inference.results_dir=$RESULTS_DIR/ocr/inference
inference.checkpoint=$RESULTS_DIR/ocr/train/best_accuracy.pth
inference.inference_dataset_dir=$DATA_DIR/test/processed
dataset.character_list_file=$DATA_DIR/train/character_list.txt
+--------------------------------------+--------------------+--------------------+
| image_path                           | predicted_labels   |   confidence score |
|--------------------------------------+--------------------+--------------------|
| /data/test/processed/l04-012_28.jpg  | lelly              |             0.3799 |
| /data/test/processed/k04-068_26.jpg  | not                |             0.9644 |
| /data/test/processed/l04-062_58.jpg  | set                |             0.9542 |
| /data/test/processed/l07-176_39.jpg  | boat               |             0.4693 |
| /data/test/processed/k04-039_39.jpg  | .                  |             0.9286 |
+--------------------------------------+--------------------+--------------------+
Export OCR model for deployment
Finally, export the OCD Model to ONNX format for deployment.
!tao model ocrnet export -e $SPECS_DIR/ocr/experiment.yaml
             	export.results_dir=$RESULTS_DIR/ocr/export
             	export.checkpoint=$RESULTS_DIR/ocr/train/best_accuracy.pth
             	export.onnx_file=$RESULTS_DIR/ocr/export/ocrnet.onnx
             	dataset.character_list_file=$DATA_DIR/train/character_list.txt
Results
Table 1 highlights the accuracy and performance of the two models featured in this post. The character detection model is fine-tuned on the ICDAR pretrained OCDNet model and character recognition model is fine-tuned on the Uber-text OCRNet pretrained model. ICDAR and Uber-text are publicly available datasets that we used to pretrain the OCDNet and OCRNet models, respectively. Both models are available on NGC.
| OCDNet | OCRNet | |
| Dataset | IAM Handwritten Dataset | |
| Backbone | Deformable Conv ResNet18 | ResNet50 |
| Accuracy | 90% | 78% |
| Inference resolution | 1024×1024 | 1x32x100 |
| Inference performance (FPS) on NVIDIA L4 GPU | 125 FPS (BS=1) | 8030 (BS=128) |
Summary
This post explains the end-to-end workflow for creating custom character detection and recognition models in NVIDIA TAO. You can start with a pretrained model for character detection (OCDNet) and character recognition (OCRNet) from NGC. Then fine-tune it on your custom dataset using TAO and export the model for inference.
Continue reading Part 2 for a step-by-step walkthrough on deploying this model into production using NVIDIA Triton.
 NVIDIA Triton Inference Server streamlines and standardizes AI inference by enabling teams to deploy, run, and scale trained ML or DL models from any framework…
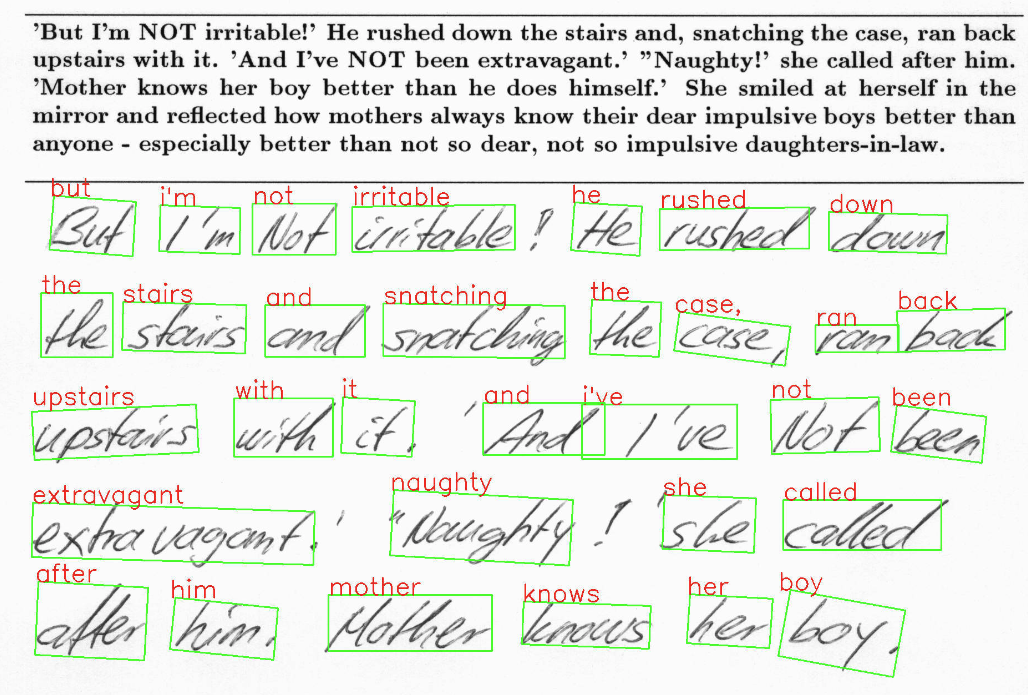
 Explore the latest streaming analytics features and advancements with this new release.
 Next-generation AI pipelines have shown incredible success in generating high-fidelity 3D models, ranging from reconstructions that produce a scene matching…
 Soccer is considered one of the most popular sports around the world. And with good reason: the action is often intense, and the game combines both physicality…
 Picture this: You’re browsing through an online store, looking for the perfect pair of running shoes. But with thousands of options available, where do you even…
 Large language models (LLMs) are becoming an integral tool for businesses to improve their operations, customer interactions, and decision-making processes….
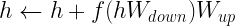
 to a lower-dimensional space followed by a nonlinear activation function, and an up-projection with
  . A residual connection adds the output of this to the input, leading to a final form: