test test scheduled post
Categories
 DataBloom
test test scheduled post
Xbox Game Pass support is coming to GeForce NOW. Members will soon be able to play supported PC games from the Xbox Game Pass catalog through NVIDIA’s cloud gaming servers. Learn more about how support for Game Pass and Microsoft Store will roll out in the coming months. Plus, Age of Empires IV: Anniversary Edition Read article >
 Machine learning has the promise to improve our world, and in many ways it already has. However, research and lived experiences continue to show this technology…
Machine learning has the promise to improve our world, and in many ways it already has. However, research and lived experiences continue to show this technology has risks. Capabilities that used to be restricted to science fiction and academia are increasingly available to the public. The responsible use and development of AI requires categorizing, assessing, and mitigating enumerated risks where practical. This is true from a pure AI standpoint but also from a standard information security perspective.
Until standards are in place and mature testing has taken hold, organizations are using red teams to explore and enumerate the immediate risks presented by AI. This post introduces the NVIDIA AI red team philosophy and the general framing of ML systems.
Our AI red team is a cross-functional team made up of offensive security professionals and data scientists. We use our combined skills to assess our ML systems to identify and help mitigate any risks from the perspective of information security.
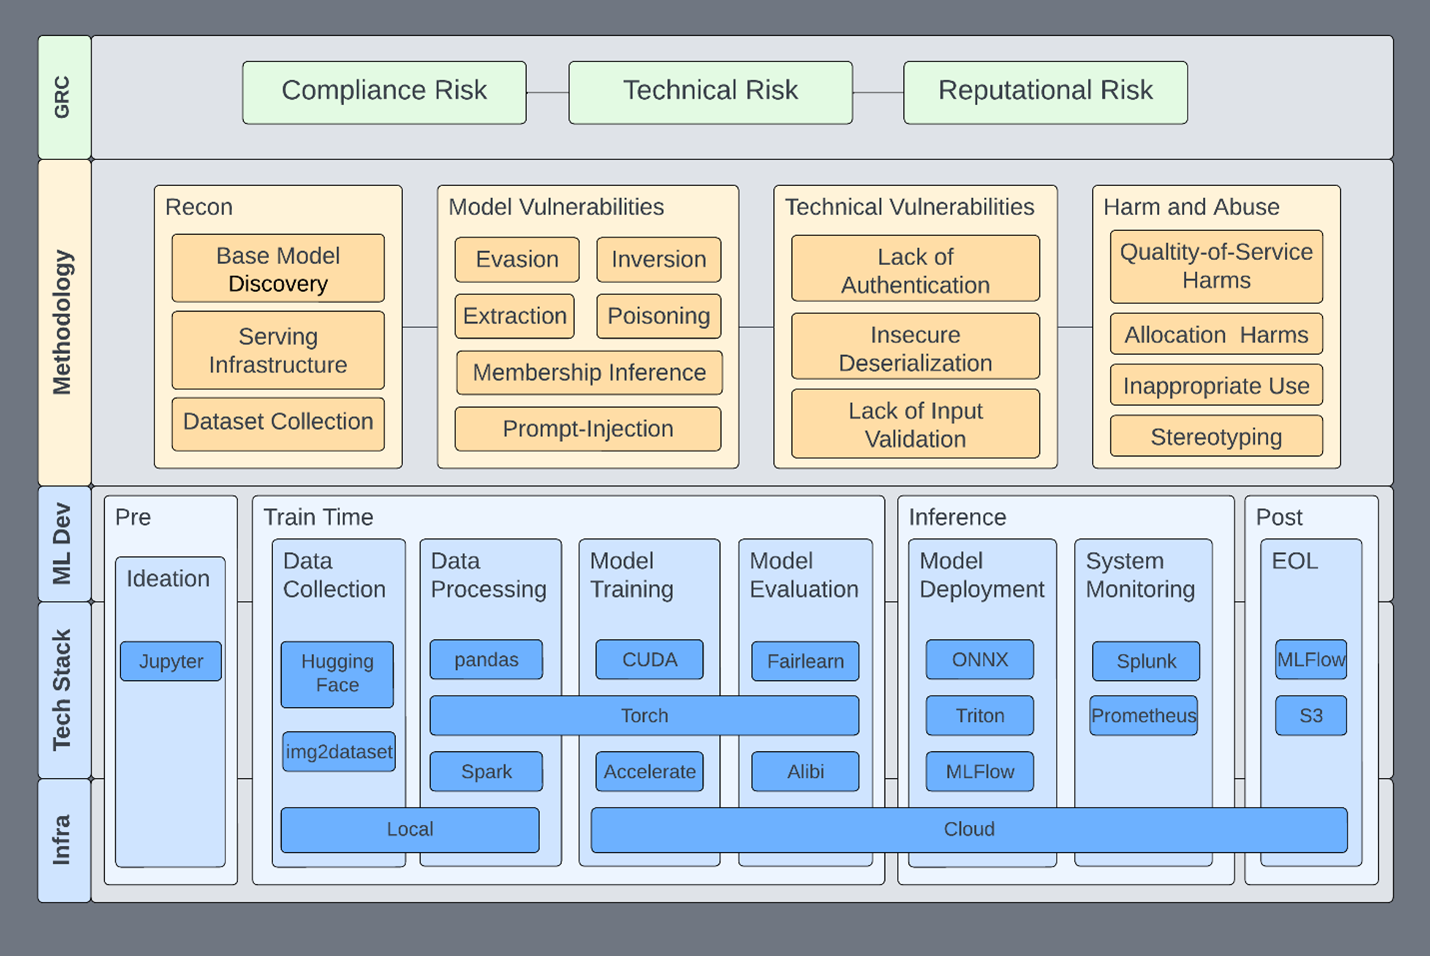
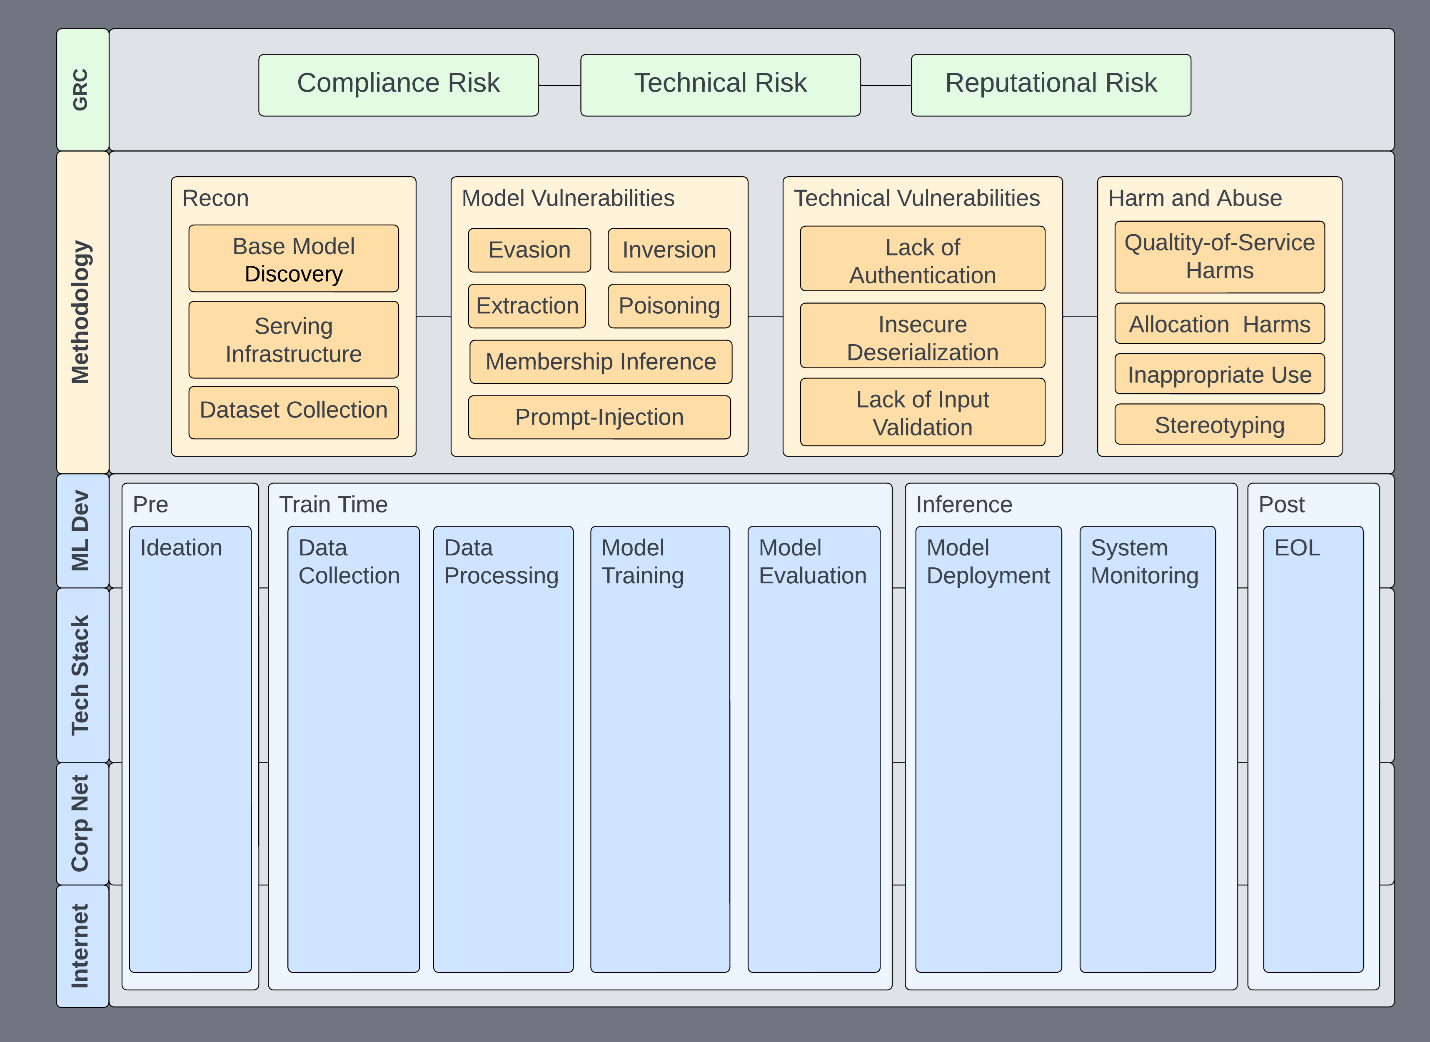
Information security has a lot of useful paradigms, tools, and network access that enable us to accelerate responsible use in all areas. This framework is our foundation and directs assessment efforts toward a standard within the organization. We use it to guide assessments (Figure 1) toward the following goals:
This helps us set expectations for what an assessment looks like, what systems we could potentially be affecting, and the risks that we address. This framework is not specific to red teaming, but some of these properties are the basis for a functional ML security program, of which red teaming is a small part.
The specific technologies—and which features go where—is not necessarily important. The important part is that there is a place for everything to go, whether you’re red teaming, vulnerability scanning, or doing any sort of assessment of an ML system.
This framework enables us to address specific issues in specific parts of the ML pipeline, infrastructure, or technologies. It becomes a place to communicate risk about issues to affected systems: up and down the stack and informing policy and technology.
Any given subsection can be isolated, expanded, and described within the context of the whole system. Here are some examples:
There are many benefits to a framework like this. Consider how a disclosure process can benefit from this composed view. The core building blocks are governance, risk, and compliance (GRC) and ML development.
As in many organizations, GRC is the top level of information security efforts, ensuring that business security requirements are enumerated, communicated, and implemented. As an AI red team under the banner of information security, here are the high-level risks we’re interested in surfacing:
These high-level risk categories are present in all information systems, including ML systems. Think of these categories like individually colored lenses on a light. Using each colored lens provides a different perspective of risks with respect to the underlying system, and sometimes the risks can be additive. For example, a technical vulnerability that leads to a breach can cause reputational damage. Depending on where the breach occurred, compliance could also require breach notification, fines, and so on.
Even if ML didn’t come with its own vulnerabilities, it is still developed, stored, and deployed on an infrastructure that is subject to standards set by GRC efforts. All assets within an organization are subject to being compliant with GRC standards. And if they aren’t, it’s ideally only because management filed and approved an exception.
The bottom of the stack is the ML development lifecycle, as it is the activity that GRC wants insight into. We generally consider an ML system as any system that involves ML, inclusive of the processes and systems by which models are built. Components of an ML system might include a web server that hosts a model for inference, a data lake holding training data, or a system that uses the model output to make a decision.
Development pipelines span multiple and sometimes incongruent systems. Each phase of the lifecycle is both unique in function and dependent on the prior phase. Because of this, ML systems tend to be tightly integrated, and the compromise of any one part of the pipeline likely affects other upstream or downstream development phases.
There are more detailed MLOps pipelines, but the canonical example is sufficient to successfully group the supporting tools and services with their lifecycle phase (Table 1).
| Phase | Description | Model state |
| Ideation | Discussions, meetings, and intention toward requirements. | Pre-development |
| Data collection | Models require data to be trained. Data is usually collected from both public and private sources with a specific model in mind. This is an ongoing process and data continues to be collected from these sources. | Train |
| Data processing | The collected data is processed in any number of ways before being introduced to an algorithm for both training and inference. | Train |
| Model training | The processed data is then ingested by an algorithm and a model is trained. | Train |
| Model evaluation | After a model is trained, it is validated to ensure accuracy, robustness, interpretability, or any number of other metrics. | Train |
| Model deployment | The trained model is embedded in a system for use in production. Machine learning is deployed in a wide variety of ways: inside autonomous vehicles, on a web API, or in client-side applications. | Inference |
| System monitoring | After the model has been deployed, the system is monitored. This includes aspects of the system that may not relate to the ML model directly. | Inference |
| End-of-life | Data shifts, business requirement changes, and innovations require that systems are discontinued properly. | Post-development |
This high-level structure enables risks to be put into the context of the whole ML system and provides some natural security boundaries to work with. For example, implementing privilege tiering between phases potentially prevents an incident from spanning an entire pipeline or multiple pipelines. Compromised or not, the purpose of the pipeline is to deploy models for use.
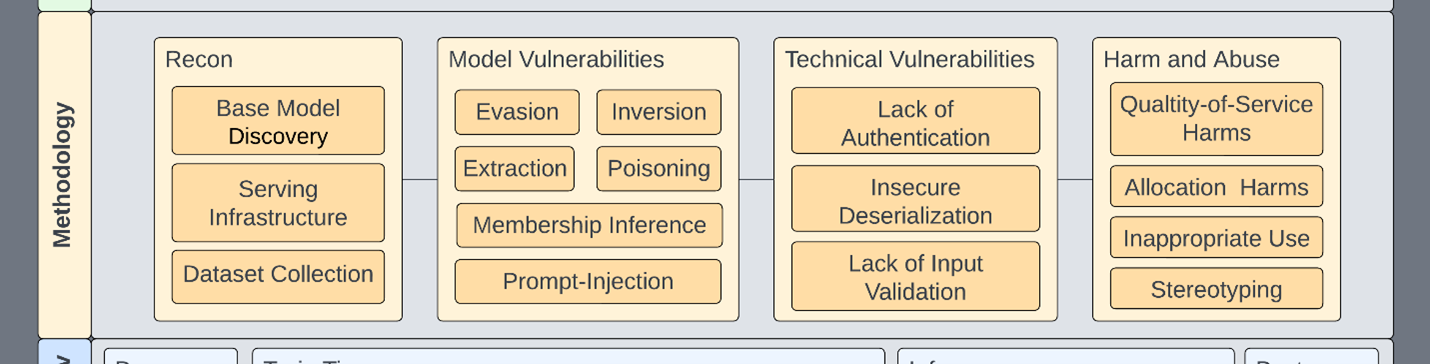
This methodology attempts to cover all primary concerns related to ML systems. In our framework, any given phase can be handed to an appropriately skilled team:
Our AI red team prefers to aggregate those skill sets on the same or adjacent teams. The increased learning and effectiveness are undeniable: Traditional red team members are part of academic papers and data scientists are given CVEs.
| Assessment phase | Description |
| Reconnaissance | This phase describes classic reconnaissance techniques found in MITRE ATT&CK or MITRE ATLAS |
| Technical vulnerabilities | All the traditional vulnerabilities you know and love. |
| Model vulnerabilities | These vulnerabilities typically come out of research spaces and cover the following: extraction, evasion, inversion, membership inference, and poisoning. |
| Harm and abuse | Models are often trained and distributed such that they can be abused for malicious or other harmful tasks. Models can also be biased intentionally or unintentionally. Or, they don’t accurately reflect the environments in which they’re deployed. |
Regardless of which team performs which assessment activity, it all remains within the same framework and feeds into the larger assessment effort. Here are some specific use cases:
In this scenario, outputs from large language models (LLMs) are clumsily put into Python exec or eval statements. Already, you can see how a composed view helps address multiple aspects, as input validation is a layer of defense against prompt injection.
Compartmentalizing each phase with security controls reduces attack surfaces and increases visibility into ML systems. An example control might be that pickles (yes, that torch file has pickles) are blocked outside of development environments, and production models must be converted to something less prone to code execution, like ONNX. This enables R&D to continue using pickles during development but prevents them from being used in sensitive environments.
While not using pickles at all would be ideal, security is often about compromises. Organizations should seek to add mitigating controls where the complete avoidance of issues is not practical.
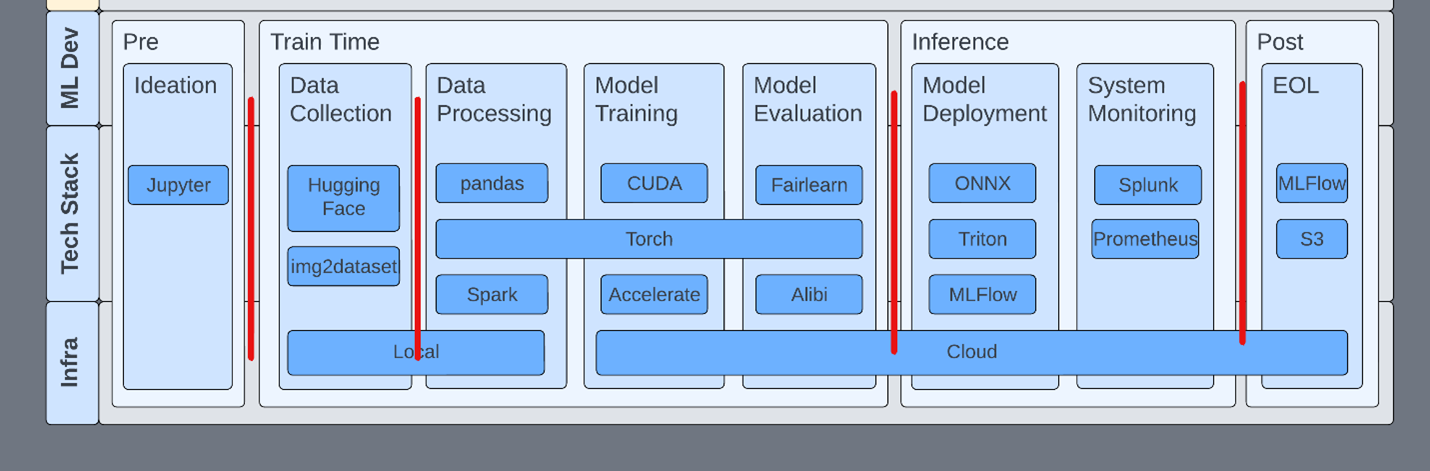
Inside a development flow, it’s important to understand the tools and their properties at each stage of the lifecycle. For example, MLFlow has no authentication by default. Starting an MLFlow server knowingly or unknowingly opens that host for exploitation through deserialization.
In another example, Jupyter servers are often started with arguments that remove authentication and TensorBoard has no authentication. This isn’t to say that TensorBoard should have authentication. Teams should just be aware of this fact and ensure that the appropriate network security rules are in place.
Consider the scope of all technologies within the development pipeline. This includes easy things like two-factor authentication on ML services like HuggingFace.
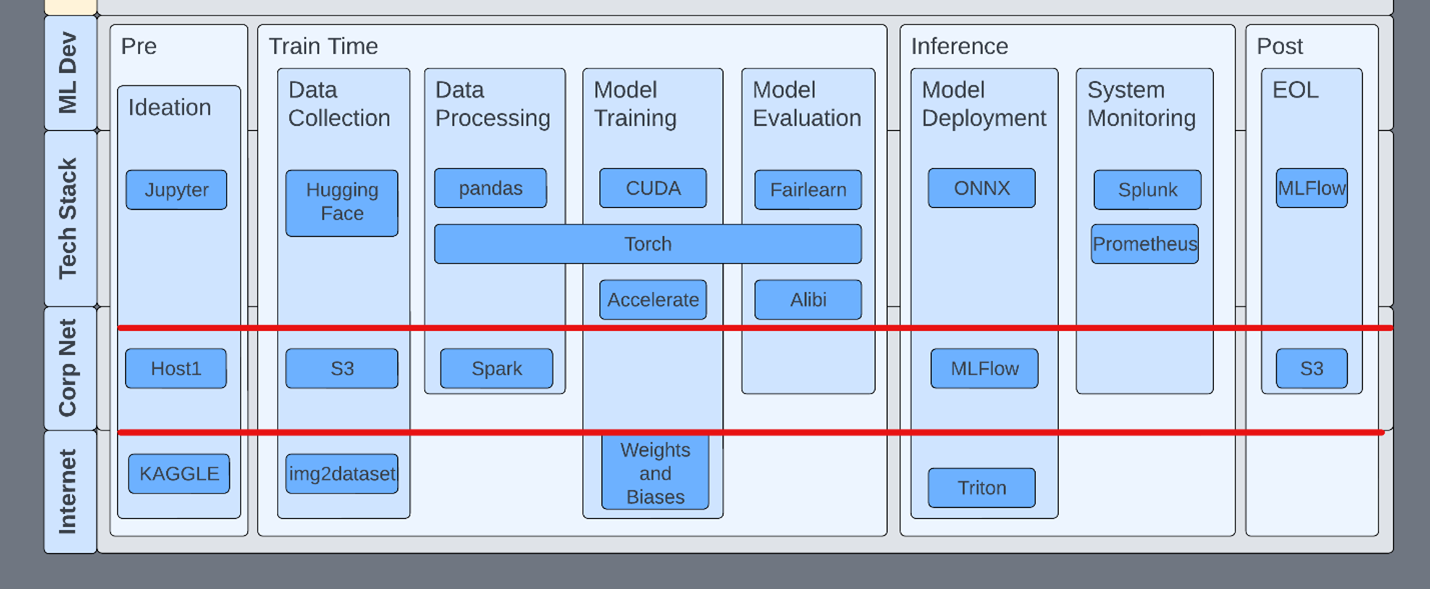
Consider how you might empty the ML development process and only consider your technologies, where they live, and the TTPs that would apply. Work your way up and down the stack. Here are some quick scenarios to think through:
These are maybe a little contrived but spend some time putting various technologies in the right buckets and then working your way up through the methodology.
These are all questions that must be answered. Some of these scenarios immediately seem like they fit into one section of the methodology. However, on closer inspection, you’ll find most of them span multiple areas.
This framework already provides you with several familiar paradigms that your organizations can start to strategize around. With a principled methodology, you can create foundations from which to build continuous security improvement, reaching toward standards and maturity from product design to production deployment. We invite you to adopt our methodology and adapt it to your own purposes.
Our methodology does not prescribe behaviors or processes. Instead, it aims to organize them. Your organization may already have mature processes to discover, manage, and mitigate risks associated with traditional applications. We hope that this framework and methodology similarly prepare you to identify and mitigate new risks from the ML components deployed in your organization.
If you have any questions, please comment below or contact threatops@nvidia.com.
 New research is boosting the creative potential of generative AI with a text-guided image-editing tool. The innovative study presents a framework using…
New research is boosting the creative potential of generative AI with a text-guided image-editing tool. The innovative study presents a framework using plug-and-play diffusion features (PnP DFs) that guides realistic and precise image generation. With this work, visual content creators can transform images into visuals with just a single prompt image and a few descriptive words.
The ability to edit and generate content reliably and with ease has the potential to expand creative possibilities for artists, designers, and creators. It could also strengthen industries reliant on animation, visual design, and image editing.
“Recent text-to-image generative models mark a new era in digital content creation. However, the main challenge in applying them to real-world applications is the lack of user-controllability, which has been largely restricted to guiding the generation solely through input text. Our work is one of the first methods to provide users with control over the image layout,” said Narek Tumanyan, a lead author and Ph.D. candidate at the Weizmann Institute of Science.
Recent breakthroughs in generative AI are unlocking new approaches for developing powerful text-to-image models. However, complexities, ambiguity, and the need for custom content limit current rendering techniques.
The study introduces a novel approach using PnP DFs that improves the image editing and generation process, giving creators greater control over their final product.
The researchers start with a simple question: How is the shape, or the outline of an image, represented and captured by diffusion models? The study explores the internal representations of images as they evolve over the generation process and examines how these representations encode shape and semantic information.
The new method controls the generated layout without training a new diffusion model or tuning it, but rather by understanding how spatial information is encoded in a pretrained text-to-image model. During the generation process, the model extracts diffusion features from an introduced guidance image and injects them into each step of the generation process resulting in fine-grained control over the structure of the new image.
By incorporating these spatial features, the diffusion model refines the new image to match the guidance structure. It does this iteratively, updating image features until it lands on a final image that preserves the guide image layout while also matching the text prompt.
“This results in a simple and effective approach, where features extracted from the guidance image are directly injected into the generation process of the translated image, requiring no training or fine-tuning,” the authors write.
This method paves the way for more advanced controlled generation and manipulation methods.
The researchers developed and tested the PNP model with the cuDNN-accelerated PyTorch framework on a single NVIDIA A100 GPU. According to the team, the large capacity of the GPU made it possible for them to focus on method development. The researchers were awarded an A100 as recipients of the NVIDIA Applied Research Accelerator Program.
Deployed on the A100, the framework transforms a new image from the guidance image and text in about 50 seconds.
The process is not only effective but also reliable, producing stunning imagery accurately. It also works beyond images, translating sketches, drawings, and animations, and can modify lighting, color, and backgrounds.
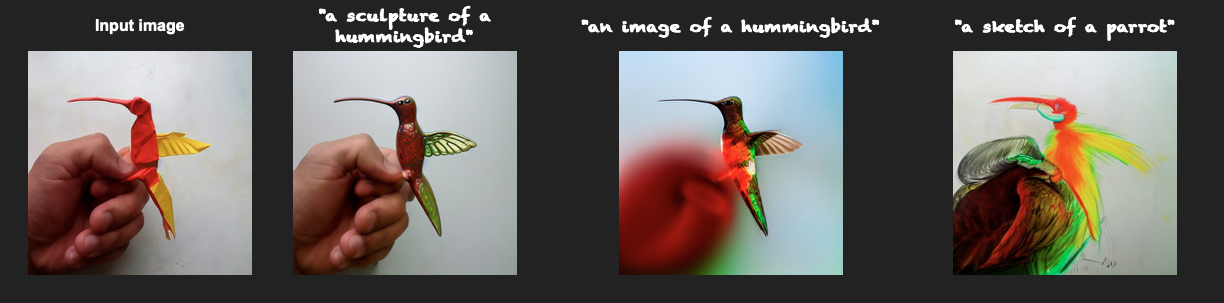
Their method also outperforms existing text-to-image models, achieving a superior balance between preserving the guidance layout and deviating from its appearance.
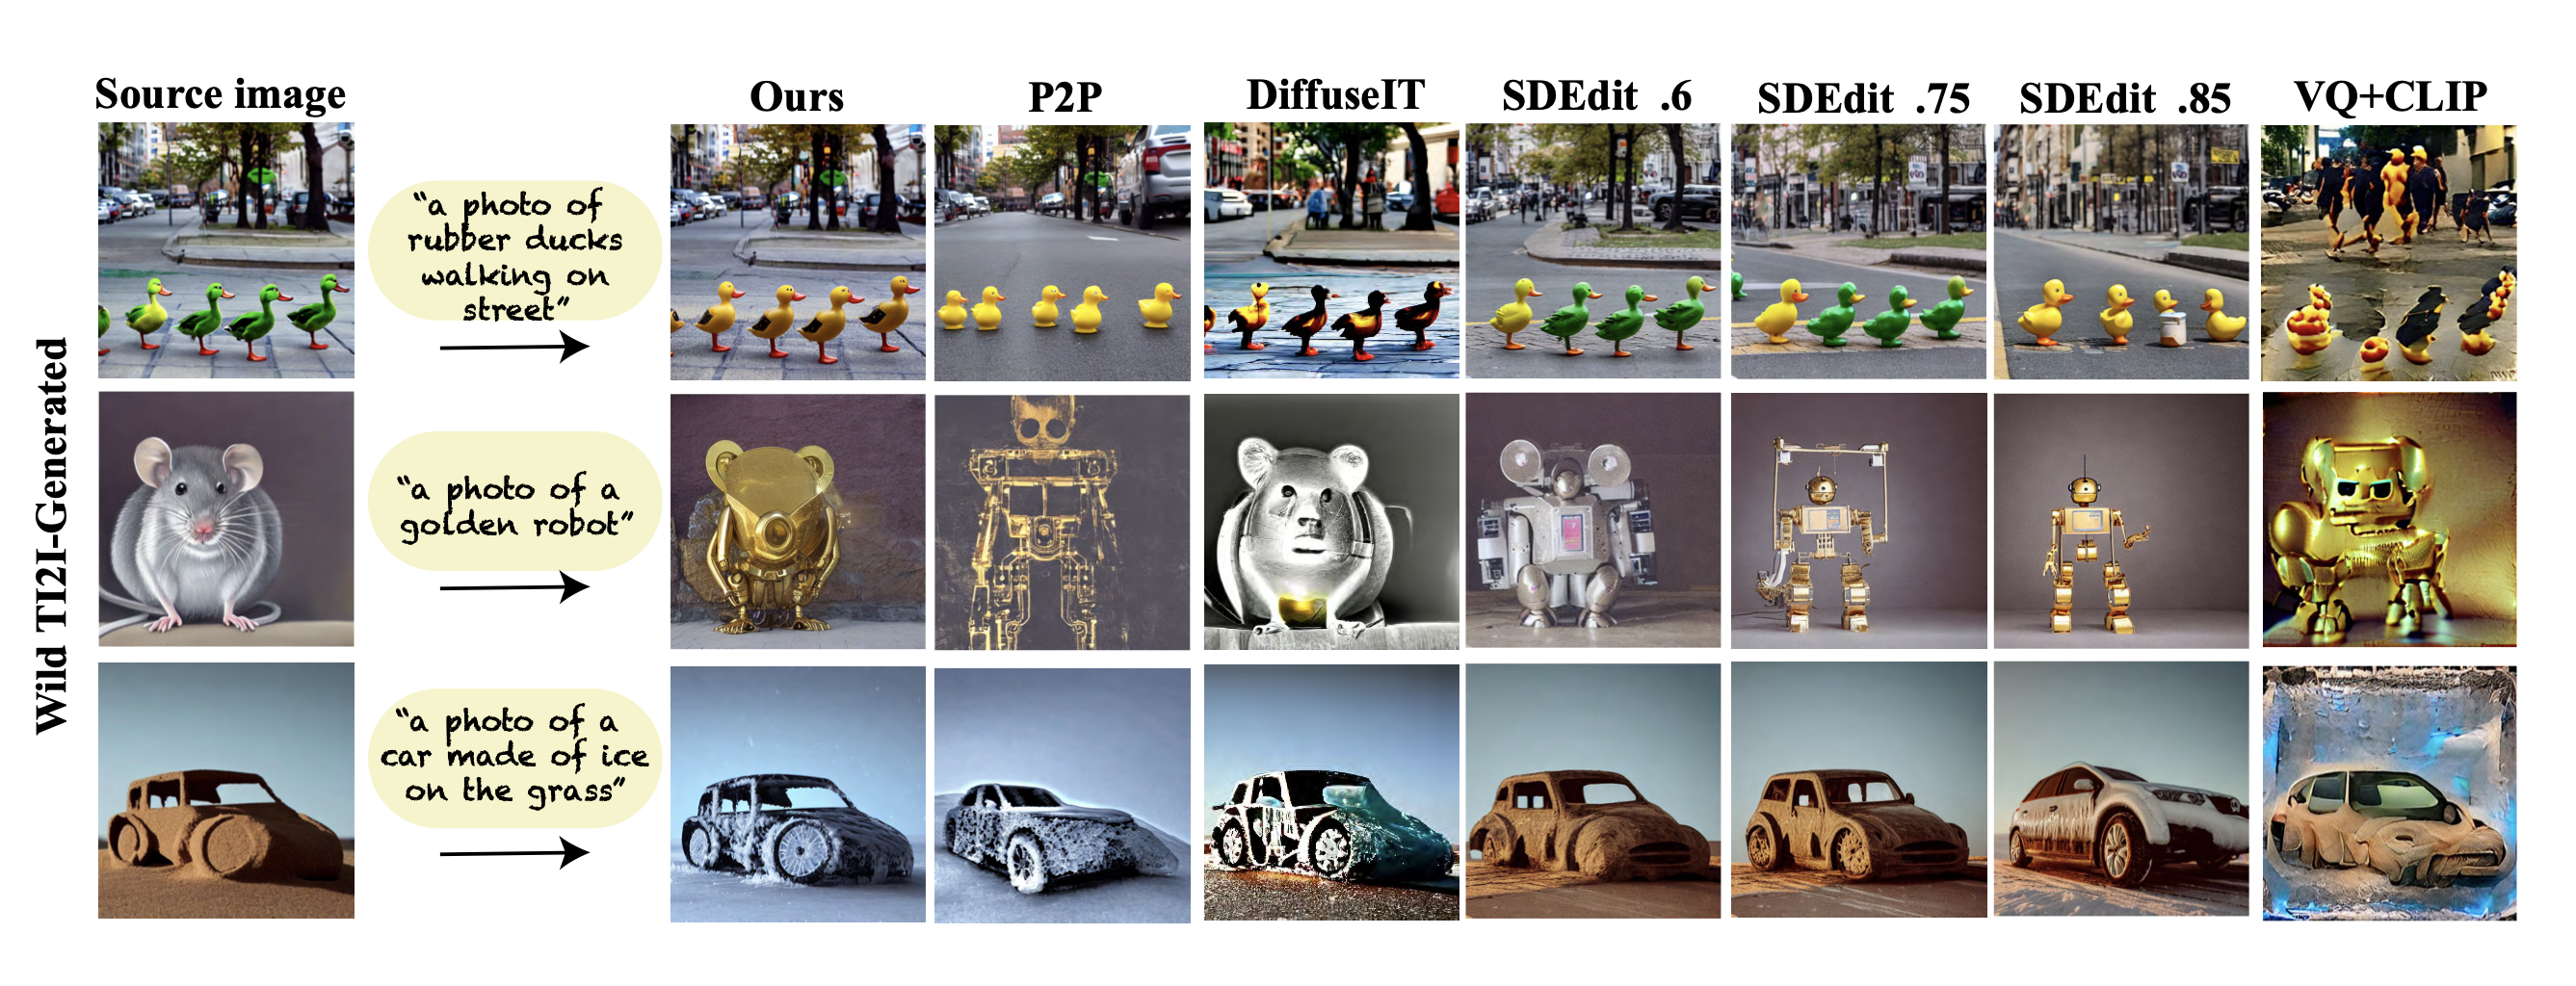
However, the model does have limitations. It does not perform well when editing image sections with arbitrary colors, as the model cannot extract semantic information from the input image.
The researchers are currently working on extending this approach to text-guided video editing. The work is also proving valuable to other research harnessing the powers of analyzing the internal representations of images in diffusion models.
For instance, one study is employing the team’s research insights to improve computer vision tasks, such as semantic point correspondence. Another focuses on expanding text-to-image generation controls, including the shape, placement, and appearance of objects.
The research team, from the Weizmann Institute of Science, is presenting their study at the CVPR 2023. The work is also open source on GitHub.
Learn more on the team’s project page.
Read the study Plug-and-Play Diffusion Features for Text-Driven Image-to-Image Translation.
See NVIDIA research delivering AI breakthroughs at CVPR 2023.
 One of the main challenges for businesses leveraging AI in their workflows is managing the infrastructure needed to support large-scale training and deployment…
One of the main challenges for businesses leveraging AI in their workflows is managing the infrastructure needed to support large-scale training and deployment of machine learning (ML) models. The NVIDIA FLARE platform provides a solution: a powerful, scalable infrastructure for federated learning that makes it easier to manage complex AI workflows across enterprises.
NVIDIA FLARE 2.3.0 is the latest release of the NVIDIA federated learning platform. It comes packed with exciting new features and enhancements, including:
This post takes a closer look at these features and explores how they can help your organization boost your AI workflows and achieve better results with machine learning.
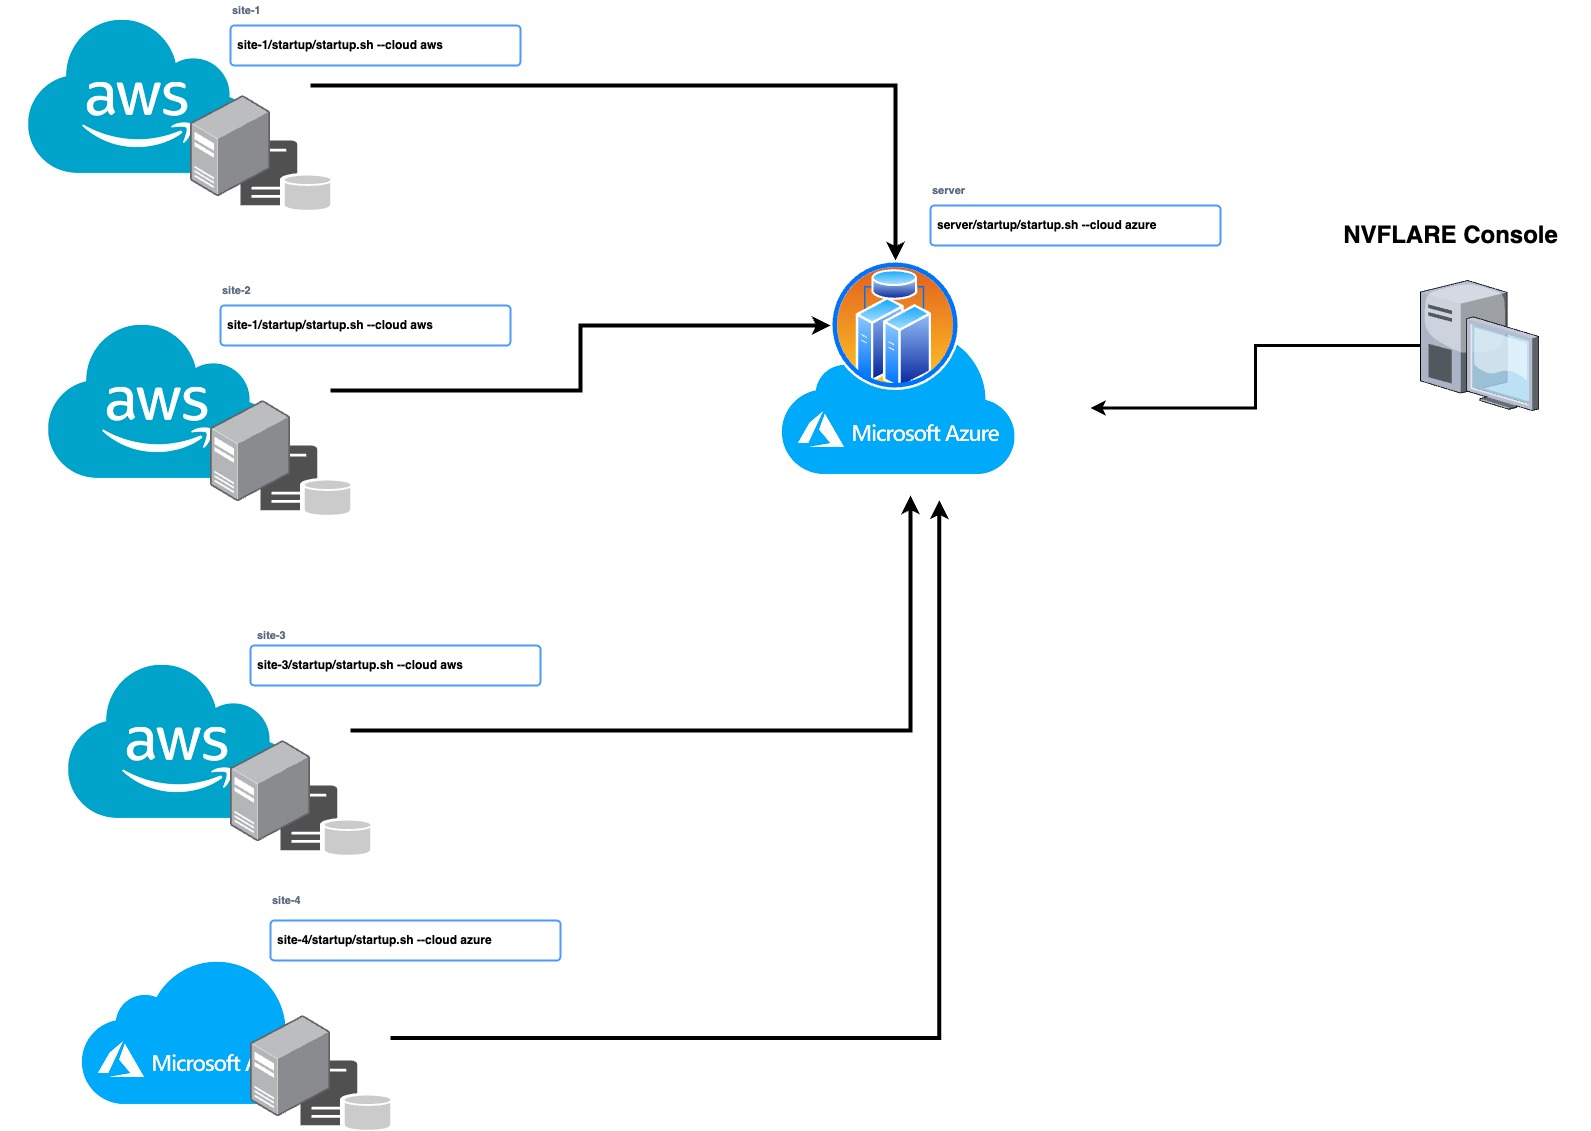
With this release, you can now seamlessly manage your multi-cloud infrastructure using IaC, leverage the strengths of different cloud providers, and distribute your workloads for improved efficiency and reliability. IaC enables you to automate the management and deployment of your infrastructure, saving time and reducing the risk of human error. NVIDIA FLARE 2.3.0 supports automated deployment on Microsoft Azure and AWS clouds.
To deploy NVIDIA FLARE in the cloud, use the NVIDIA FLARE CLI commands to create the infrastructure, deploy, and start the Dashboard UI, FL Server, and FL Client(s). To create and deploy NVIDIA FLARE in the cloud, follow the commands from the NVIDIA FLARE startup kit, which is a signed software package generated from the NVIDIA FLARE provisioning process and distributed to server and clients.
/start.sh --cloud azure | aws
/start.sh --cloud azure | aws

nvflare dashboard --cloud azure | aws
These commands will create the resource group, networking, security, compute runtime instances, and more (infrastructure-as-code) and deploy the NVIDIA FLARE client or server to the newly created virtual machine (VM). Each startup kit contains a unique configuration for the FLARE server or client that can be deployed independently. This gives users the flexibility to deploy on-prem or on a mix of cloud service providers (for example server on AWS and clients on Azure and/or AWS) for a simple hybrid multi-cloud configuration.
Large language models (LLMs) are unlocking new possibilities in numerous industries. Drug discovery in healthcare is one example—see Build Generative AI Pipelines for Drug Discovery with NVIDIA BioNeMo Service for more details.
Leveraging federated learning in LLM training has many benefits, including:
To illustrate these capabilities, NVIDIA FLARE 2.3.0 introduces NLP named entity recognition (NER) examples with GPT-2 (Generative Pretrained Transformer 2) and BERT (Bidirectional Encoder Representations from Transformers) models. Visit NVIDIA/NVFlare on GitHub for more details. Parameter-efficient tuning and related work are in progress, along with additional LLM model examples for future releases.
NVIDIA FLARE has the capability to support a variety of NLP tasks with different backbone models, such as NER, text classification, and language generation.
This release focuses on the application of NER using the NCBI disease dataset, which contains abstracts from biomedical research papers annotated with disease mentions. The dataset is commonly used for benchmarking NER models in the biomedical domain. For more information, see NCBI Disease Corpus: A Resource for Disease Name Recognition and Concept Normalization.
The task of NER involves identifying named entities in text and classifying them into predefined categories. In the case of the NCBI disease dataset, the objective is to recognize and capture the disease mentions.
To tackle the NER task, the NVIDIA FLARE example explores the use of two popular models, BERT and GPT-2. BERT is a pretrained transformer-based model that is widely used for a variety of NLP tasks, including NER. GPT-2 is another transformer-based model that is primarily used for language generation, but can also be fine-tuned for NER.
The BERT-base-uncased and GPT-2 models have 110 million and 124 million parameters, respectively. The number of parameters in a model is an indication of its size and complexity. Larger models with more parameters tend to learn more intricate relationships within the data. However, they also require more computing resources and take longer to train than smaller models.
Upcoming releases will include support for larger, billion-parameter models and other tasks.
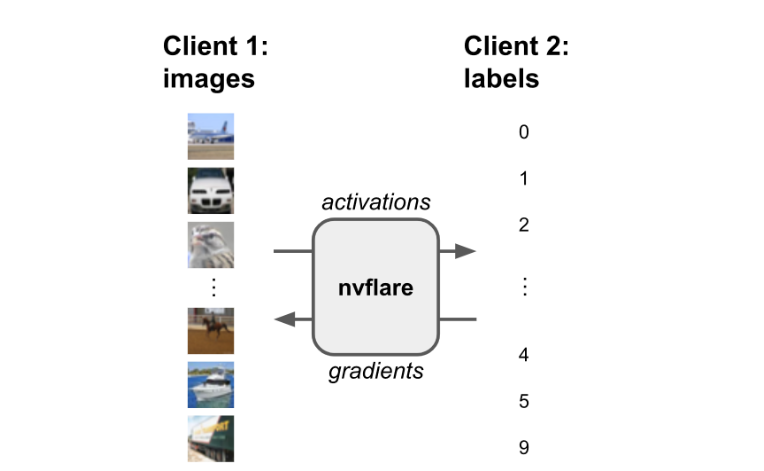
Split learning is a technique that enables multiple parties to collaboratively train a machine learning model on their respective datasets without having to share their raw data with each other. The model is split into two or more parts, and each part can run on one of the participating parties.
This approach has several advantages over traditional ML methods, especially in scenarios where data privacy is a major concern. Like federated learning, split learning never shares raw data among the parties. This means that sensitive information can be kept confidential, while enabling the parties to gain insights and benefit from the collaboration.
The NVIDIA FLARE 2.3.0 release shows an example of split learning in which the data and label can be separated into two different sites. It is possible to achieve data and model protection by placing part of the model on one site and sending activations/embeddings to another site to calculate the loss. This technique can be seen in the CIFAR10 split learning example.
NVIDIA FLARE 2.3.0 enables you to quickly deploy to multi-cloud and explore NLP examples for LLMs, and demonstrates split learning capability. By incorporating these features into workflows, teams can save time, improve accuracy, reduce risk, and boost AI workflows.
In addition to the features detailed in this post, NVIDIA FLARE 2.3.0 comes with many other features, including:
For more information, check out the NVIDIA FLARE documentation, NVIDIA AI and Data Science forum, NVIDIA/NVFlare on GitHub, and the paper, NVIDIA FLARE: Federated Learning from Simulation to Real-World.

When choosing a venue, we often find ourselves with questions like the following: Does this restaurant have the right vibe for a date? Is there good outdoor seating? Are there enough screens to watch the game? While photos and videos may partially answer questions like these, they are no substitute for feeling like you’re there, even when visiting in person isn’t an option.
Immersive experiences that are interactive, photorealistic, and multi-dimensional stand to bridge this gap and recreate the feel and vibe of a space, empowering users to naturally and intuitively find the information they need. To help with this, Google Maps launched Immersive View, which uses advances in machine learning (ML) and computer vision to fuse billions of Street View and aerial images to create a rich, digital model of the world. Beyond that, it layers helpful information on top, like the weather, traffic, and how busy a place is. Immersive View provides indoor views of restaurants, cafes, and other venues to give users a virtual up-close look that can help them confidently decide where to go.
Today we describe the work put into delivering these indoor views in Immersive View. We build on neural radiance fields (NeRF), a state-of-the-art approach for fusing photos to produce a realistic, multi-dimensional reconstruction within a neural network. We describe our pipeline for creation of NeRFs, which includes custom photo capture of the space using DSLR cameras, image processing and scene reproduction. We take advantage of Alphabet’s recent advances in the field to design a method matching or outperforming the prior state-of-the-art in visual fidelity. These models are then embedded as interactive 360° videos following curated flight paths, enabling them to be available on smartphones.
| The reconstruction of The Seafood Bar in Amsterdam in Immersive View. |
At the core of our work is NeRF, a recently-developed method for 3D reconstruction and novel view synthesis. Given a collection of photos describing a scene, NeRF distills these photos into a neural field, which can then be used to render photos from viewpoints not present in the original collection.
While NeRF largely solves the challenge of reconstruction, a user-facing product based on real-world data brings a wide variety of challenges to the table. For example, reconstruction quality and user experience should remain consistent across venues, from dimly-lit bars to sidewalk cafes to hotel restaurants. At the same time, privacy should be respected and any potentially personally identifiable information should be removed. Importantly, scenes should be captured consistently and efficiently, reliably resulting in high-quality reconstructions while minimizing the effort needed to capture the necessary photographs. Finally, the same natural experience should be available to all mobile users, regardless of the device on hand.
| The Immersive View indoor reconstruction pipeline. |
The first step to producing a high-quality NeRF is the careful capture of a scene: a dense collection of photos from which 3D geometry and color can be derived. To obtain the best possible reconstruction quality, every surface should be observed from multiple different directions. The more information a model has about an object’s surface, the better it will be in discovering the object’s shape and the way it interacts with lights.
In addition, NeRF models place further assumptions on the camera and the scene itself. For example, most of the camera’s properties, such as white balance and aperture, are assumed to be fixed throughout the capture. Likewise, the scene itself is assumed to be frozen in time: lighting changes and movement should be avoided. This must be balanced with practical concerns, including the time needed for the capture, available lighting, equipment weight, and privacy. In partnership with professional photographers, we developed a strategy for quickly and reliably capturing venue photos using DSLR cameras within only an hour timeframe. This approach has been used for all of our NeRF reconstructions to date.
Once the capture is uploaded to our system, processing begins. As photos may inadvertently contain sensitive information, we automatically scan and blur personally identifiable content. We then apply a structure-from-motion pipeline to solve for each photo’s camera parameters: its position and orientation relative to other photos, along with lens properties like focal length. These parameters associate each pixel with a point and a direction in 3D space and constitute a key signal in the NeRF reconstruction process.
Unlike many ML models, a new NeRF model is trained from scratch on each captured location. To obtain the best possible reconstruction quality within a target compute budget, we incorporate features from a variety of published works on NeRF developed at Alphabet. Some of these include:
We train each NeRF model on TPU or GPU accelerators, which provide different trade-off points. As with all Google products, we continue to search for new ways to improve, from reducing compute requirements to improving reconstruction quality.
| A side-by-side comparison of our method and a mip-NeRF 360 baseline. |
Once a NeRF is trained, we have the ability to produce new photos of a scene from any viewpoint and camera lens we choose. Our goal is to deliver a meaningful and helpful user experience: not only the reconstructions themselves, but guided, interactive tours that give users the freedom to naturally explore spaces from the comfort of their smartphones.
To this end, we designed a controllable 360° video player that emulates flying through an indoor space along a predefined path, allowing the user to freely look around and travel forward or backwards. As the first Google product exploring this new technology, 360° videos were chosen as the format to deliver the generated content for a few reasons.
On the technical side, real-time inference and baked representations are still resource intensive on a per-client basis (either on device or cloud computed), and relying on them would limit the number of users able to access this experience. By using videos, we are able to scale the storage and delivery of videos to all users by taking advantage of the same video management and serving infrastructure used by YouTube. On the operations side, videos give us clearer editorial control over the exploration experience and are easier to inspect for quality in large volumes.
While we had considered capturing the space with a 360° camera directly, using a NeRF to reconstruct and render the space has several advantages. A virtual camera can fly anywhere in space, including over obstacles and through windows, and can use any desired camera lens. The camera path can also be edited post-hoc for smoothness and speed, unlike a live recording. A NeRF capture also does not require the use of specialized camera hardware.
Our 360° videos are rendered by ray casting through each pixel of a virtual, spherical camera and compositing the visible elements of the scene. Each video follows a smooth path defined by a sequence of keyframe photos taken by the photographer during capture. The position of the camera for each picture is computed during structure-from-motion, and the sequence of pictures is smoothly interpolated into a flight path.
To keep speed consistent across different venues, we calibrate the distances for each by capturing pairs of images, each of which is 3 meters apart. By knowing measurements in the space, we scale the generated model, and render all videos at a natural velocity.
The final experience is surfaced to the user within Immersive View: the user can seamlessly fly into restaurants and other indoor venues and discover the space by flying through the photorealistic 360° videos.
We believe that this feature is the first step of many in a journey towards universally accessible, AI-powered, immersive experiences. From a NeRF research perspective, more questions remain open. Some of these include:
| Reconstruction of an outdoor scene with a NeRF model trained on Street View panoramas. |
As we continue to grow, we look forward to engaging with and contributing to the community to build the next generation of immersive experiences.
This work is a collaboration across multiple teams at Google. Contributors to the project include Jon Barron, Julius Beres, Daniel Duckworth, Roman Dudko, Magdalena Filak, Mike Harm, Peter Hedman, Claudio Martella, Ben Mildenhall, Cardin Moffett, Etienne Pot, Konstantinos Rematas, Yves Sallat, Marcos Seefelder, Lilyana Sirakovat, Sven Tresp and Peter Zhizhin.
Also, we’d like to extend our thanks to Luke Barrington, Daniel Filip, Tom Funkhouser, Charles Goran, Pramod Gupta, Mario Lučić, Isalo Montacute and Dan Thomasset for valuable feedback and suggestions.
 Large language models (LLMs) have generated excitement worldwide due to their ability to understand and process human language at a scale that is unprecedented….
Large language models (LLMs) have generated excitement worldwide due to their ability to understand and process human language at a scale that is unprecedented. It has transformed the way that we interact with technology.
Having been trained on a vast corpus of text, LLMs can manipulate and generate text for a wide variety of applications without much instruction or training. However, the quality of this generated output is heavily dependent on the instruction that you give the model, which is referred to as a prompt. What does this mean for you? Interacting with the models today is the art of designing a prompt rather than engineering the model architecture or training data.
Dealing with LLMs can come at a cost given the expertise and resources required to build and train your models. NVIDIA NeMo offers pretrained language models that can be flexibly adapted to solve almost any language processing task while we can focus entirely on the art of getting the best outputs from the available LLMs.
In this post, I discuss a few ways of getting around with LLMs, so that you can make the best out of them. For more information about getting started with LLMs, see An Introduction to Large Language Models: Prompt Engineering and P-Tuning.
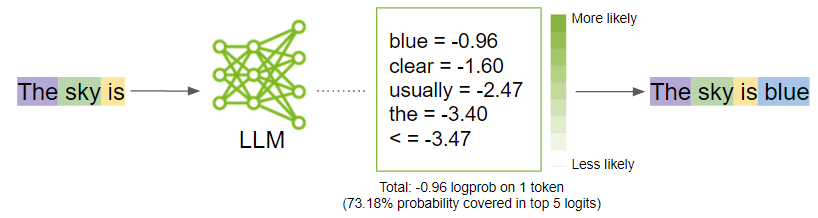
Before I get into the strategies to generate optimal outputs, step back and understand what happens when you prompt a model. The prompt is broken down into smaller chunks called tokens and is sent as input to the LLM, which then generates the next possible tokens based on the prompt.
LLMs interpret the textual data as tokens. Tokens are words or chunks of characters. For example, the word “sandwich” would be broken down into the tokens “sand” and “wich”, whereas common words like “time” and “like” would be a single token.
NeMo uses byte-pair encoding to create these tokens. The prompt is broken down into a list of tokens that are taken as input by the LLM.
Behind the curtains, the model first generates logits for each possible output token. Logits are a function that represents probability values from 0 to 1, and negative infinity to infinity. Those logits then are passed to a softmax function to generate probabilities for each possible output, giving you a probability distribution over the vocabulary. Here is the softmax equation for calculating the actual probability of a token:
In the formula, 


The model would then select the most likely word and add it to the prompt sequence.
While the model decides what is the most probable output, you can influence those probabilities by turning some model parameter knobs up and down. In the next section, I discuss what those parameters are and how to tune them to get the best outputs.
To unlock the full potential of LLMs, explore the art of refining the outputs. Here are the key parameter categories to consider tweaking:
Play around with these parameters and figure out the best combinations that work for your specific use case. In many cases, experimenting with the temperature parameter can get what you might need. However, if you have something specific and want more granular control over the output, start experimenting with the other ones.
There are parameters that can guide the model to decide when to stop generating any further text:
Earlier, I mentioned that the LLM is focused on generating the next token given the sequence of tokens. The model does this in a loop appending the predicted token to the input sequence. You wouldn’t want the LLM to go on and on.
While there is a limit to the number of tokens ranging from 2048 to 4096 that NeMo models can accept for now, I don’t recommend hitting these limits as the model may generate off responses.
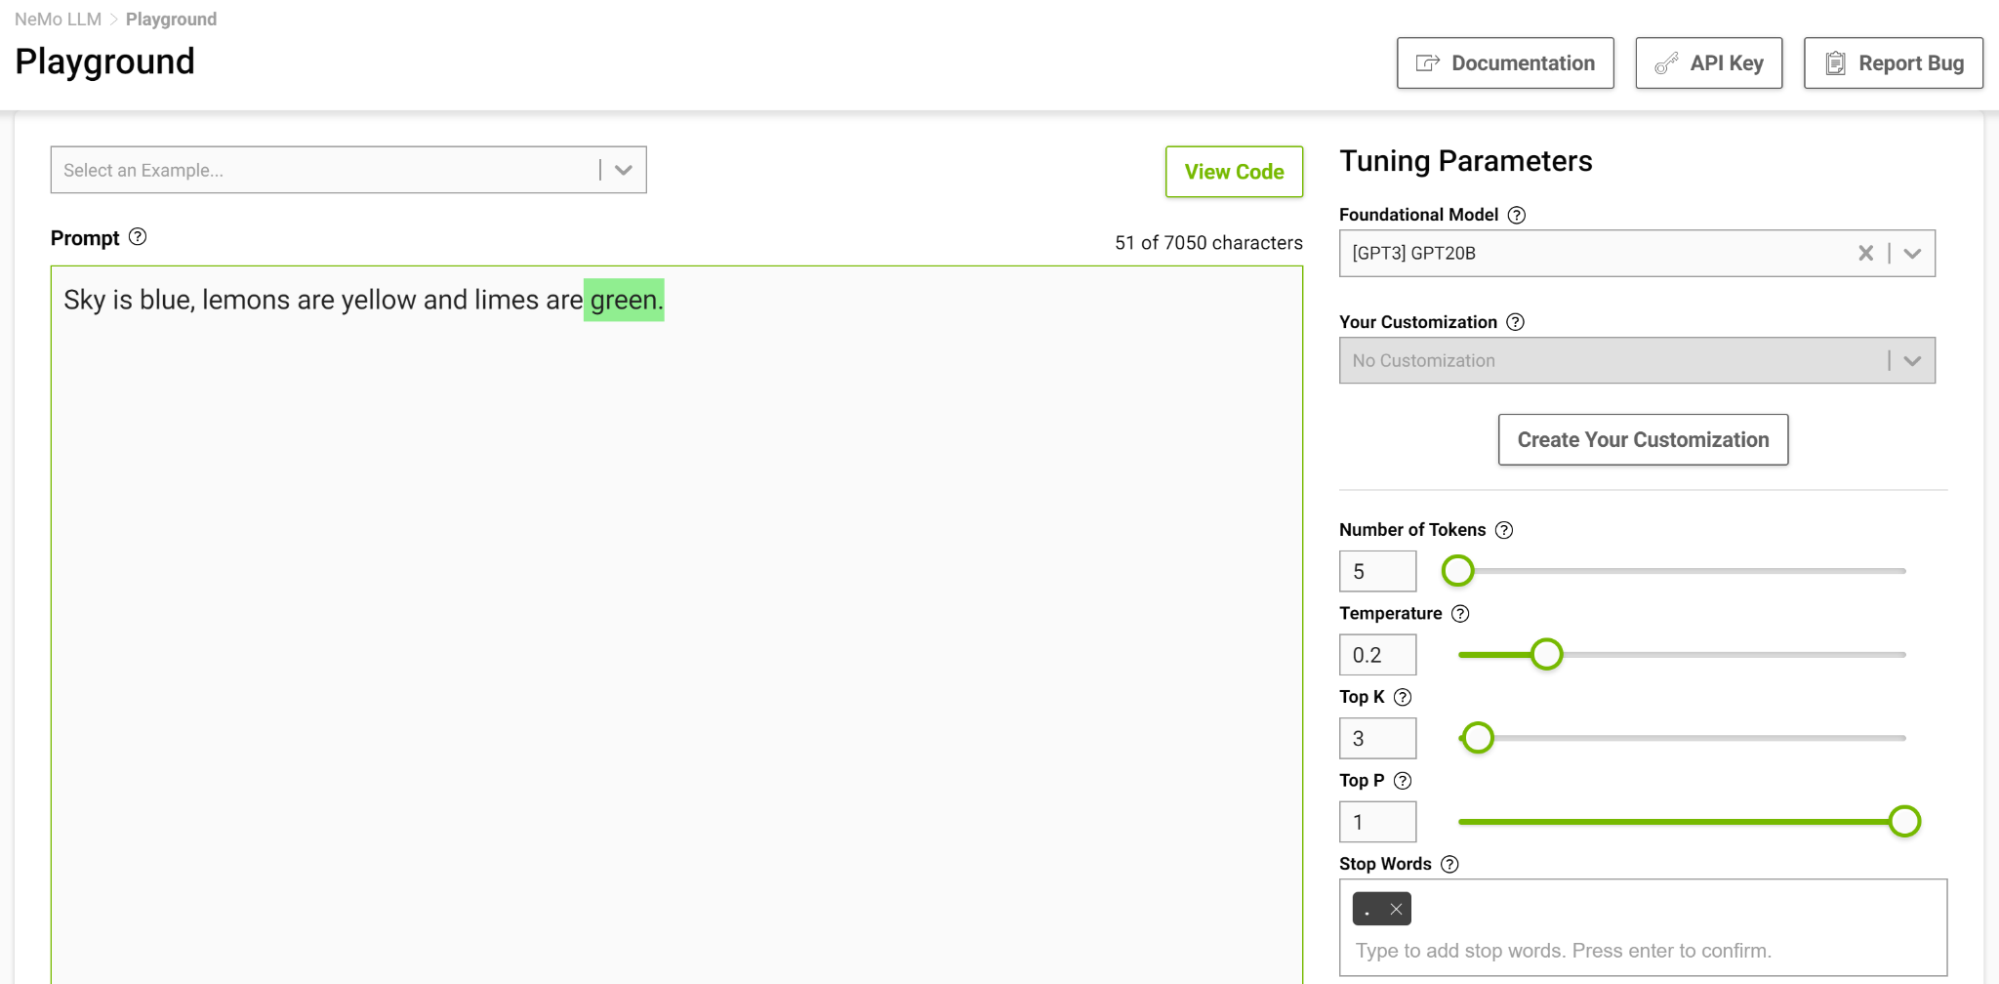
Stop words are a set of character sequences that tells the model to stop generating any additional text, even if the output length has not reached the specified token limit.
This is another way to control the length of the output. For example, if the model is prompted to complete the following sentence “Sky is blue, lemons are yellow and limes are” and you specify the stop word as just “.”, the model stops after finishing just this sentence, even if the token limit is higher than the generated sequence (Figure 2).
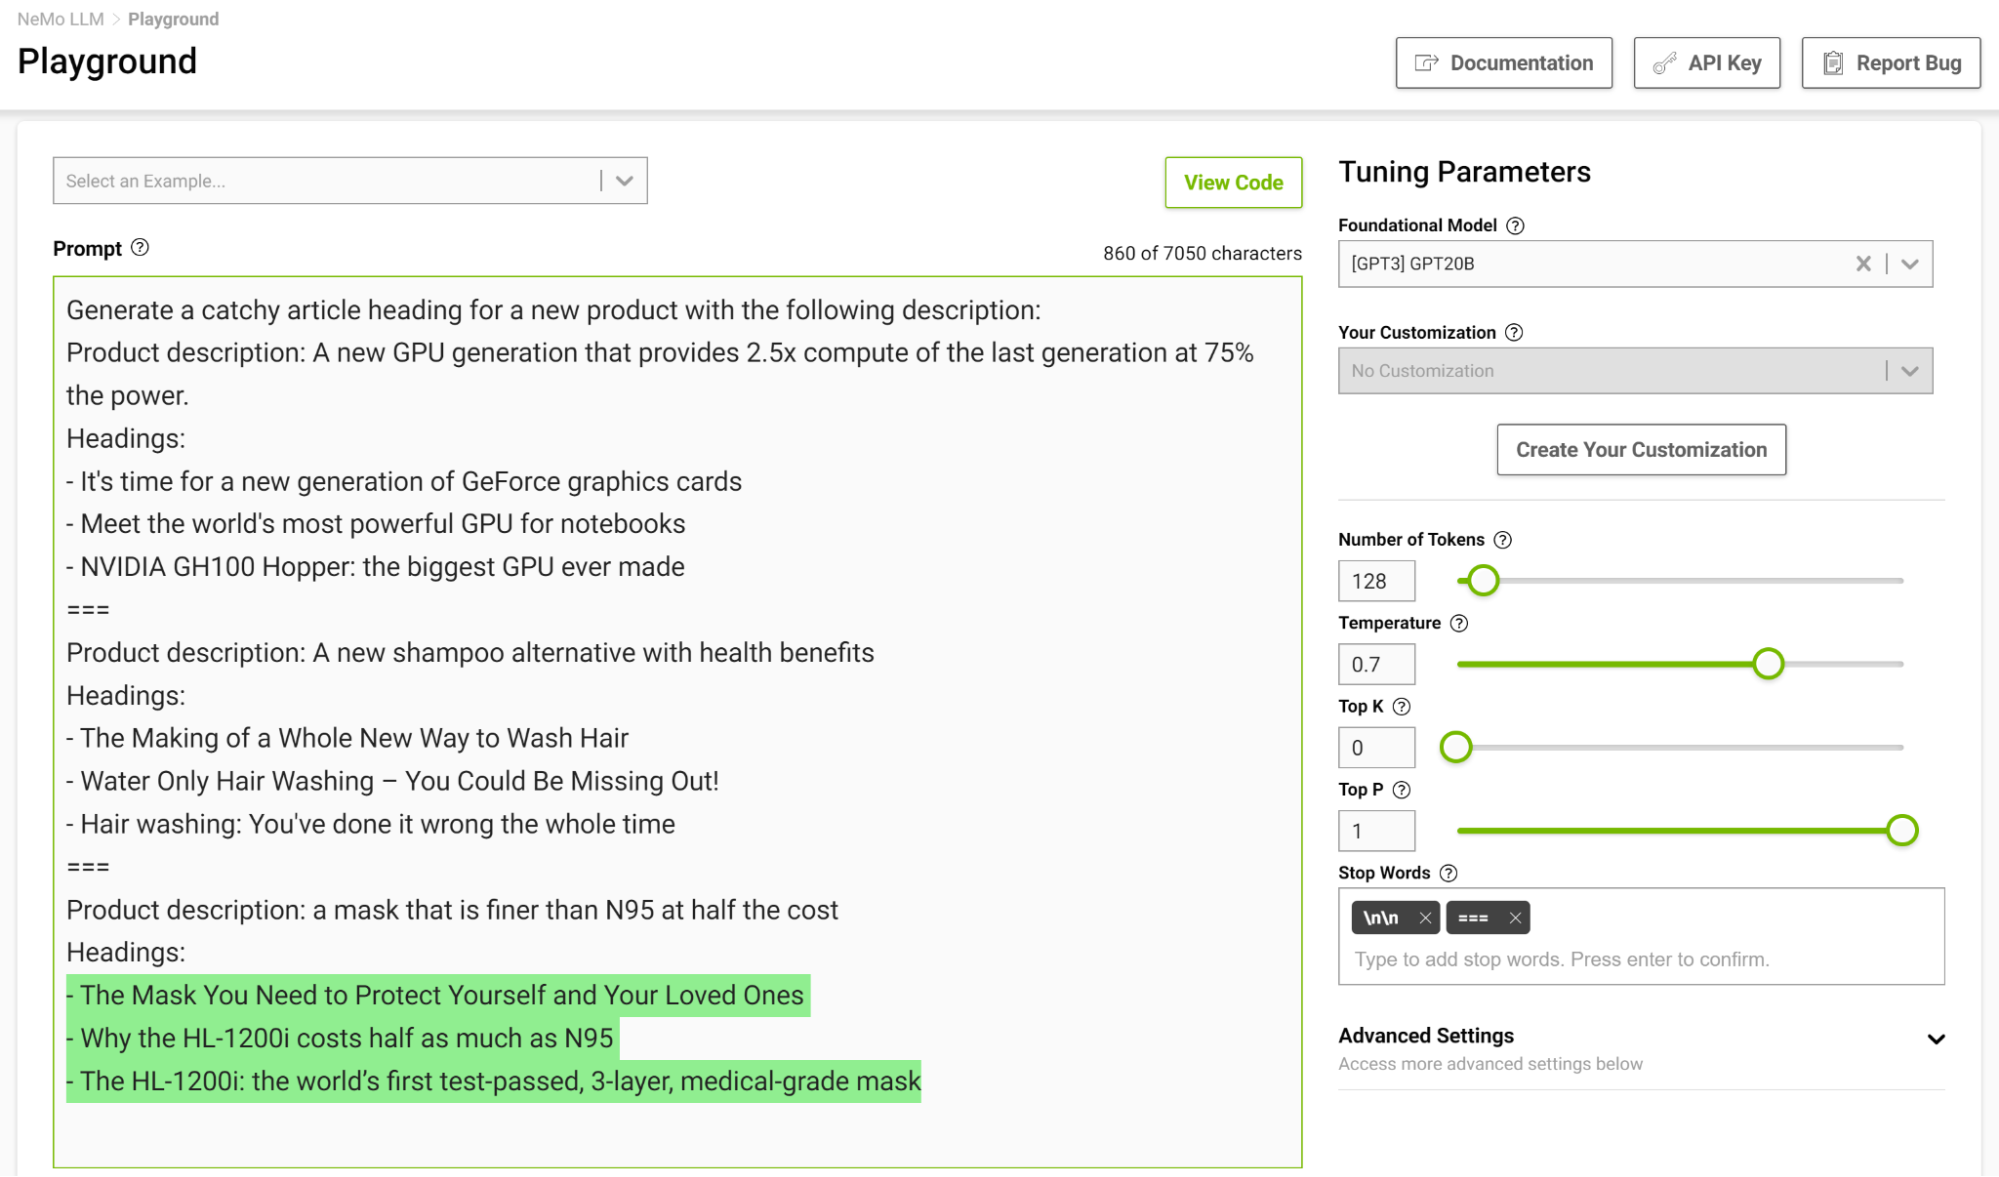
It is especially useful to design a stopping template in a few-shot setting so the model can learn to stop appropriately upon completing an intended task. Figure 3 shows separating examples with the string “===” and passing that as the stop word.
Given a prompt, it is possible to generate different outputs based on the parameters you set. Based on the application of the LLM, you can choose to increase or decrease the creative ability of the model. Here are a few of these parameters that can help you do so:
This parameter controls the creative ability of your model. As discussed earlier, while generating the next token in the input sequence, the model comes up with a probability distribution. The temperature parameter adjusts the shape of this distribution, leading to more diversity in the generated text.
At a lower temperature, the model is more conservative and is limited to choosing tokens with higher probabilities. As you increase the temperature, that limit gets lenient, allowing the model to choose lesser probable words, resulting in more unpredictable and creative text.
Figure 4 shows tasking the model to complete the sentence starting with “The ocean” where you set the temperature to 0.1.

When you think of completing such a phrase, you would probably think of phrases like “…is huge” or “…is blue”. The output is pretty much a simple fact that the ocean is big with lots of fish.
Now, try this again with the temperature setting at 1 (Figure 5).
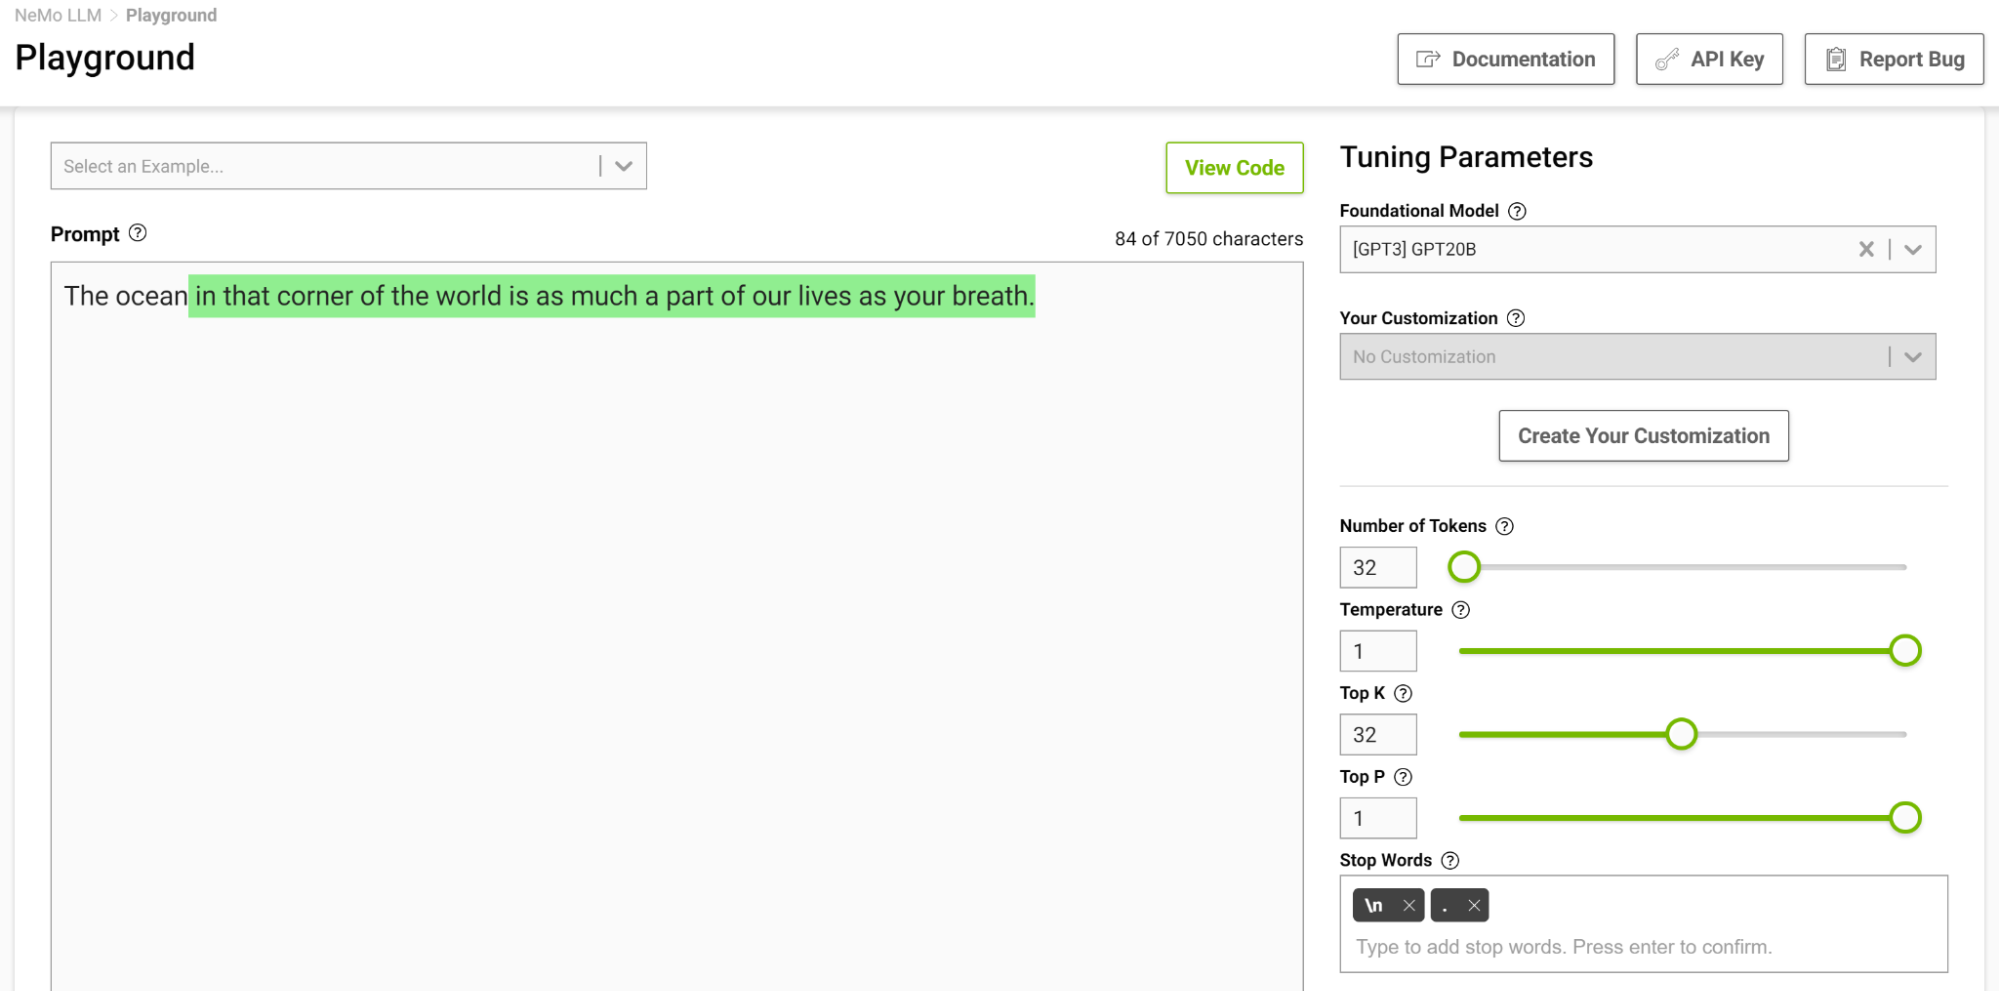
The model started to give you analogies that you commonly don’t think of. Higher temperatures are suitable for tasks that require creative writing like poems and stories. But beware that the generated text can sometimes also turn out nonsensical. Lower temperatures are suitable for more definitive tasks like question-answering or summarization.
I recommend experimenting with different temperature values to find the best temperature for your use case. The range [0.5, 0.8] should be a good starting point in the NeMo service playground.
These two parameters also control the randomness of selecting the next token. Top-k tells the model that it has to keep the top k highest probability tokens, from which the next token is selected at random. Lower values reduce randomness as you are clipping off less likely tokens generating predictable text. If k is set to 0, Top-k is not used. When set to 1, it is always going to select the most probable token next.
There can be cases when the probability distribution for the possible token could be broad where there are so many tokens that are likely. There can also be cases where the distribution is narrow where there are only a few tokens that are more likely.
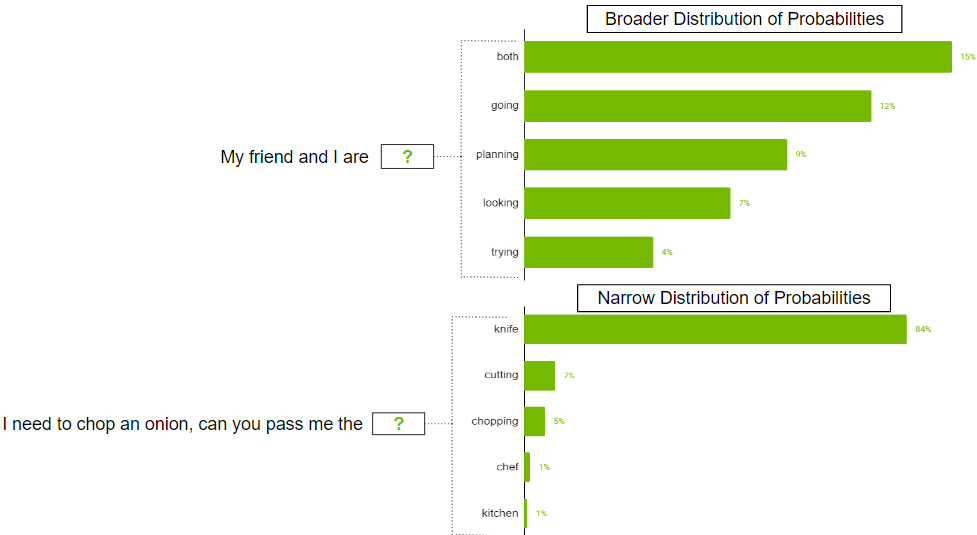
You probably don’t want to strictly restrict the model to just select the top k tokens in the broader distribution scenario. To address this, parameter top-p can be used where the model picks at random from the highest probability tokens whose probabilities sum to or exceed the top-p value. If top-p is set to 0.9, one of the following scenarios may occur:
This is another helpful parameter that can control the diversity of outputs. Beam search is an algorithm commonly used in many NLP and speech recognition models as a final decision-making step to choose the best output given the possible options. Beam search width is a parameter that determines the number of candidates that the algorithm should consider at each step in the search.
Higher values increase the chance of finding a good output, but that also comes at the cost of more computation.
Sometimes, repeated text might not be desirable in the output. If this is the case, use the repetition penalty parameter to help reduce repetition.
This parameter can help penalize tokens based on how frequently they occur in the text, including the input prompt. A token that has already appeared five times is penalized more heavily than a token that has appeared only one time. A value of 1 means that there is no penalty and values larger than 1 discourage repeated tokens.
Prompt design is crucial for generating relevant and coherent outputs from the LLMs. Having strategies for effective prompt design can help create prompts that are relevant while avoiding common pitfalls like bias, ambiguity, or lack of specificity. In this section, I share some key strategies for effective prompt design.
Constraining the model’s behavior through careful prompt design can be quite useful. You know that language models at their core are trying to predict the next word in a sequence. A task description that makes perfect sense to a human might not be understood by the language model. This is why few-shot learning often works well: as you demonstrate a pattern to the model, it does a good job adhering to it.
Consider the following prompt, “Translate English to French: Today is a beautiful day.”
With this prompt, the model would likely try to continue the sentence or add more sentences rather than performing the translation. Changing the prompt to, “Translate this English sentence to French: Today is a beautiful day.” increases the likelihood of the model understanding this task as a translation task and generates a more reliable output.
As you saw in the previous translation example, small changes can lead to varied outputs. Another thing to note is tokens are often generated with a leading space, so characters like space and next line can also affect your outputs. If a prompt is not working out, try changing the way that you structured it.
Often when you want your model to answer your prompts logically and arrive at accurate conclusions or simply to make the model achieve a certain outcome, you can consider using the following phrases:
To obtain more accurate answers, you can prompt the LLM to generate potentially useful knowledge about a given question before generating a final answer (Figure 7).
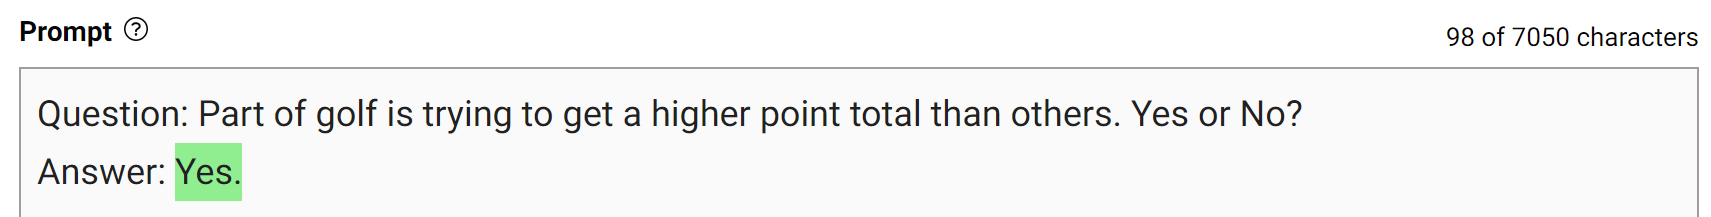
This type of mistake shows that LLMs sometimes require more knowledge to answer a question. The next examples show generating a few facts about golf scoring in a few-shot setting.
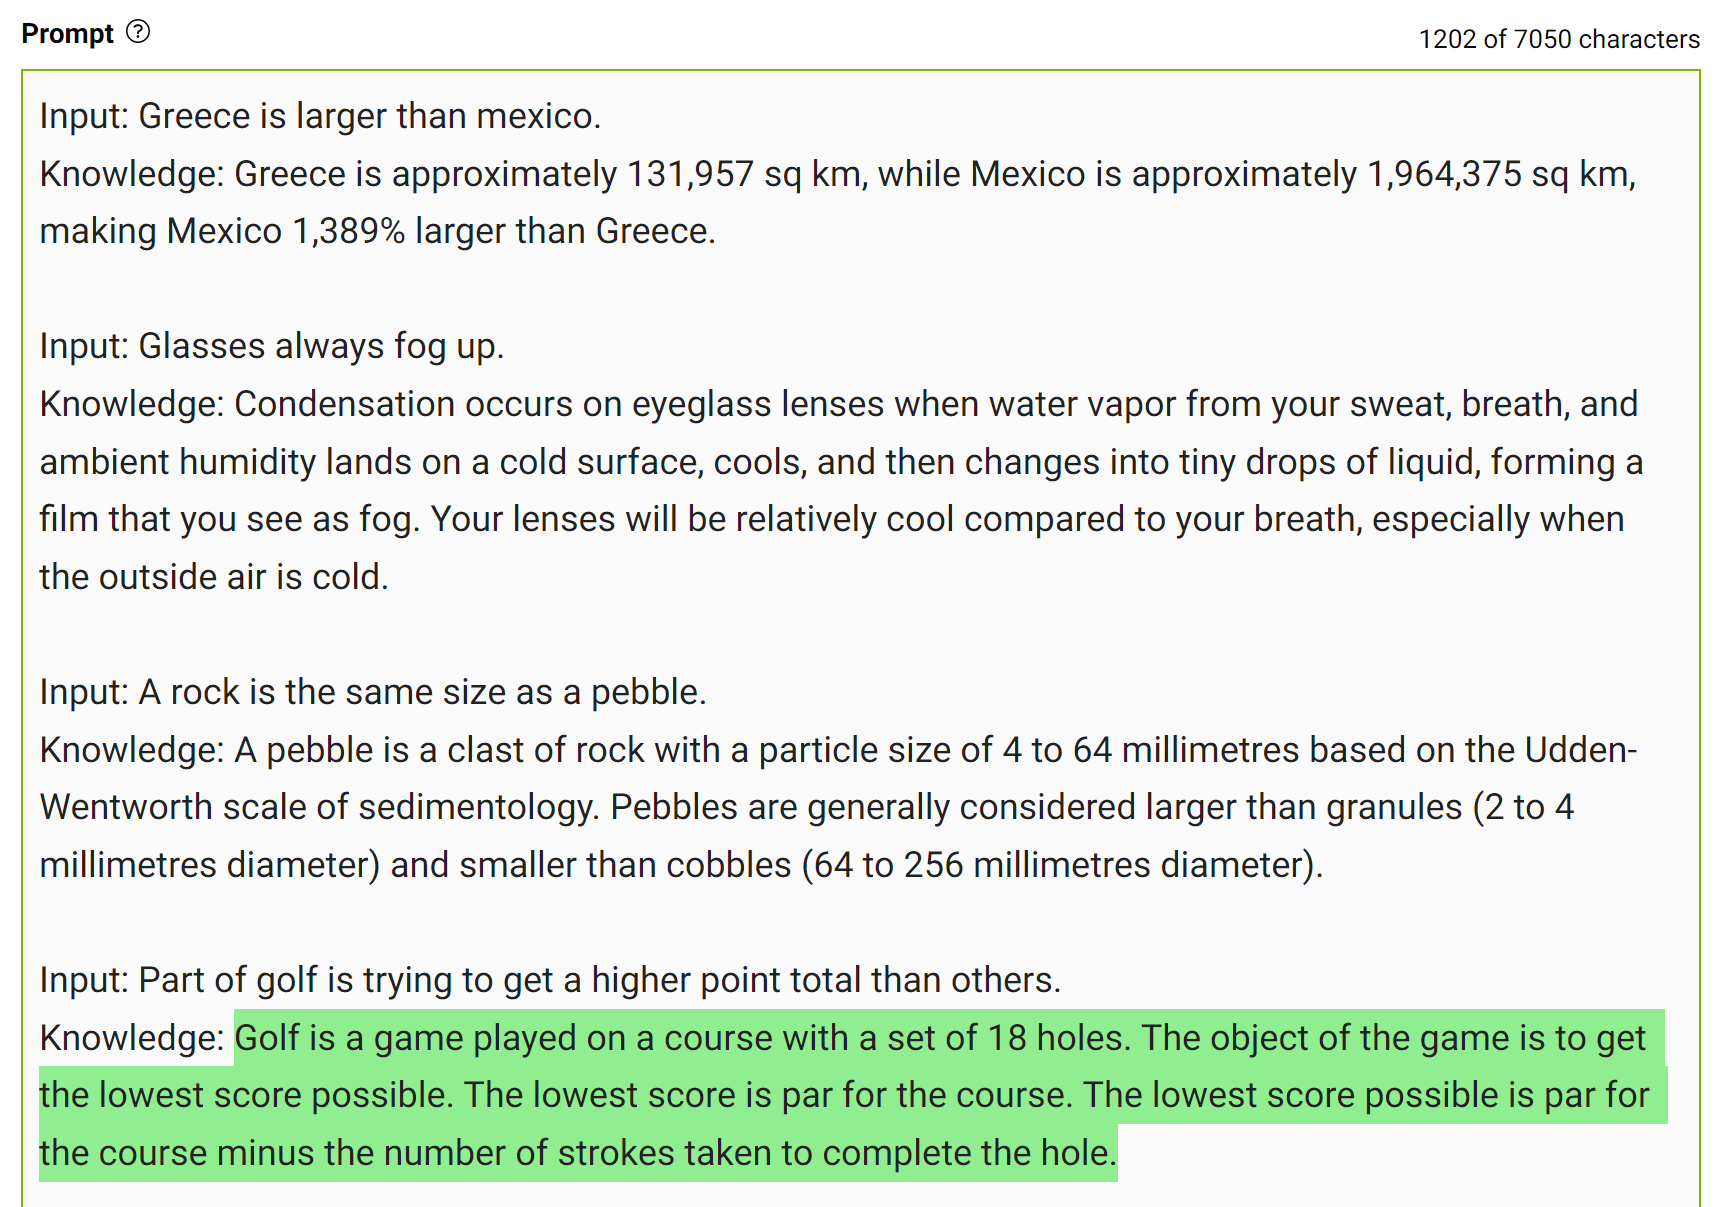
Integrate this knowledge into the prompt and ask the question again.
The model confidently answered “No” to the same question. This is a simple demonstration of this kind of prompting. However, there are some more details to consider before arriving at the final answer. For more information, see Generated Knowledge Prompting for Commonsense Reasoning.
In practice, you generate multiple answers and select the most frequently occurring answer as the final one.
The best way to write prompts that fit your use case is to experiment and play around. It is a learning experience to engineer a prompt that can get you the right outputs, whether it’s how you write it or the way you set model parameters.
The NeMo service playground can help you test out your prompts and craft your use case. If you are interested in accessing the playground, see NVIDIA NeMo Service.
In this post, I shared ways to generate better outputs from LLMs. I discussed how model parameters could be tweaked to get desired outputs and some strategies to engineer your prompts.
Stay up to date on LLM technologies, learnings, and breakthroughs by signing up for the LLM newsletter.
When California skies turned orange in the wake of devastating wildfires, a startup fused computer vision and generative AI to fight back. “With the 2020 wildfires, it became very personal, so we asked fire officials how we could help,” said Emrah Gultekin, the Turkish-born CEO of Chooch, a Silicon Valley-based leader in computer vision. California Read article >
With over 900,000 subscribers on her YouTube channel, editor and filmmaker Sara Dietschy creates docuseries, reviews and vlogs that explore the intersection of technology and creativity.
People have the remarkable ability to take in a tremendous amount of information (estimated to be ~1010 bits/s entering the retina) and selectively attend to a few task-relevant and interesting regions for further processing (e.g., memory, comprehension, action). Modeling human attention (the result of which is often called a saliency model) has therefore been of interest across the fields of neuroscience, psychology, human-computer interaction (HCI) and computer vision. The ability to predict which regions are likely to attract attention has numerous important applications in areas like graphics, photography, image compression and processing, and the measurement of visual quality.
We’ve previously discussed the possibility of accelerating eye movement research using machine learning and smartphone-based gaze estimation, which earlier required specialized hardware costing up to $30,000 per unit. Related research includes “Look to Speak”, which helps users with accessibility needs (e.g., people with ALS) to communicate with their eyes, and the recently published “Differentially private heatmaps” technique to compute heatmaps, like those for attention, while protecting users’ privacy.
In this blog, we present two papers (one from CVPR 2022, and one just accepted to CVPR 2023) that highlight our recent research in the area of human attention modeling: “Deep Saliency Prior for Reducing Visual Distraction” and “Learning from Unique Perspectives: User-aware Saliency Modeling”, together with recent research on saliency driven progressive loading for image compression (1, 2). We showcase how predictive models of human attention can enable delightful user experiences such as image editing to minimize visual clutter, distraction or artifacts, image compression for faster loading of webpages or apps, and guiding ML models towards more intuitive human-like interpretation and model performance. We focus on image editing and image compression, and discuss recent advances in modeling in the context of these applications.
Human attention models usually take an image as input (e.g., a natural image or a screenshot of a webpage), and predict a heatmap as output. The predicted heatmap on the image is evaluated against ground-truth attention data, which are typically collected by an eye tracker or approximated via mouse hovering/clicking. Previous models leveraged handcrafted features for visual clues, like color/brightness contrast, edges, and shape, while more recent approaches automatically learn discriminative features based on deep neural networks, from convolutional and recurrent neural networks to more recent vision transformer networks.
In “Deep Saliency Prior for Reducing Visual Distraction” (more information on this project site), we leverage deep saliency models for dramatic yet visually realistic edits, which can significantly change an observer’s attention to different image regions. For example, removing distracting objects in the background can reduce clutter in photos, leading to increased user satisfaction. Similarly, in video conferencing, reducing clutter in the background may increase focus on the main speaker (example demo here).
To explore what types of editing effects can be achieved and how these affect viewers’ attention, we developed an optimization framework for guiding visual attention in images using a differentiable, predictive saliency model. Our method employs a state-of-the-art deep saliency model. Given an input image and a binary mask representing the distractor regions, pixels within the mask will be edited under the guidance of the predictive saliency model such that the saliency within the masked region is reduced. To make sure the edited image is natural and realistic, we carefully choose four image editing operators: two standard image editing operations, namely recolorization and image warping (shift); and two learned operators (we do not define the editing operation explicitly), namely a multi-layer convolution filter, and a generative model (GAN).
With those operators, our framework can produce a variety of powerful effects, with examples in the figure below, including recoloring, inpainting, camouflage, object editing or insertion, and facial attribute editing. Importantly, all these effects are driven solely by the single, pre-trained saliency model, without any additional supervision or training. Note that our goal is not to compete with dedicated methods for producing each effect, but rather to demonstrate how multiple editing operations can be guided by the knowledge embedded within deep saliency models.
 |
| Examples of reducing visual distractions, guided by the saliency model with several operators. The distractor region is marked on top of the saliency map (red border) in each example. |
Prior research assumes a single saliency model for the whole population. However, human attention varies between individuals — while the detection of salient clues is fairly consistent, their order, interpretation, and gaze distributions can differ substantially. This offers opportunities to create personalized user experiences for individuals or groups. In “Learning from Unique Perspectives: User-aware Saliency Modeling”, we introduce a user-aware saliency model, the first that can predict attention for one user, a group of users, and the general population, with a single model.
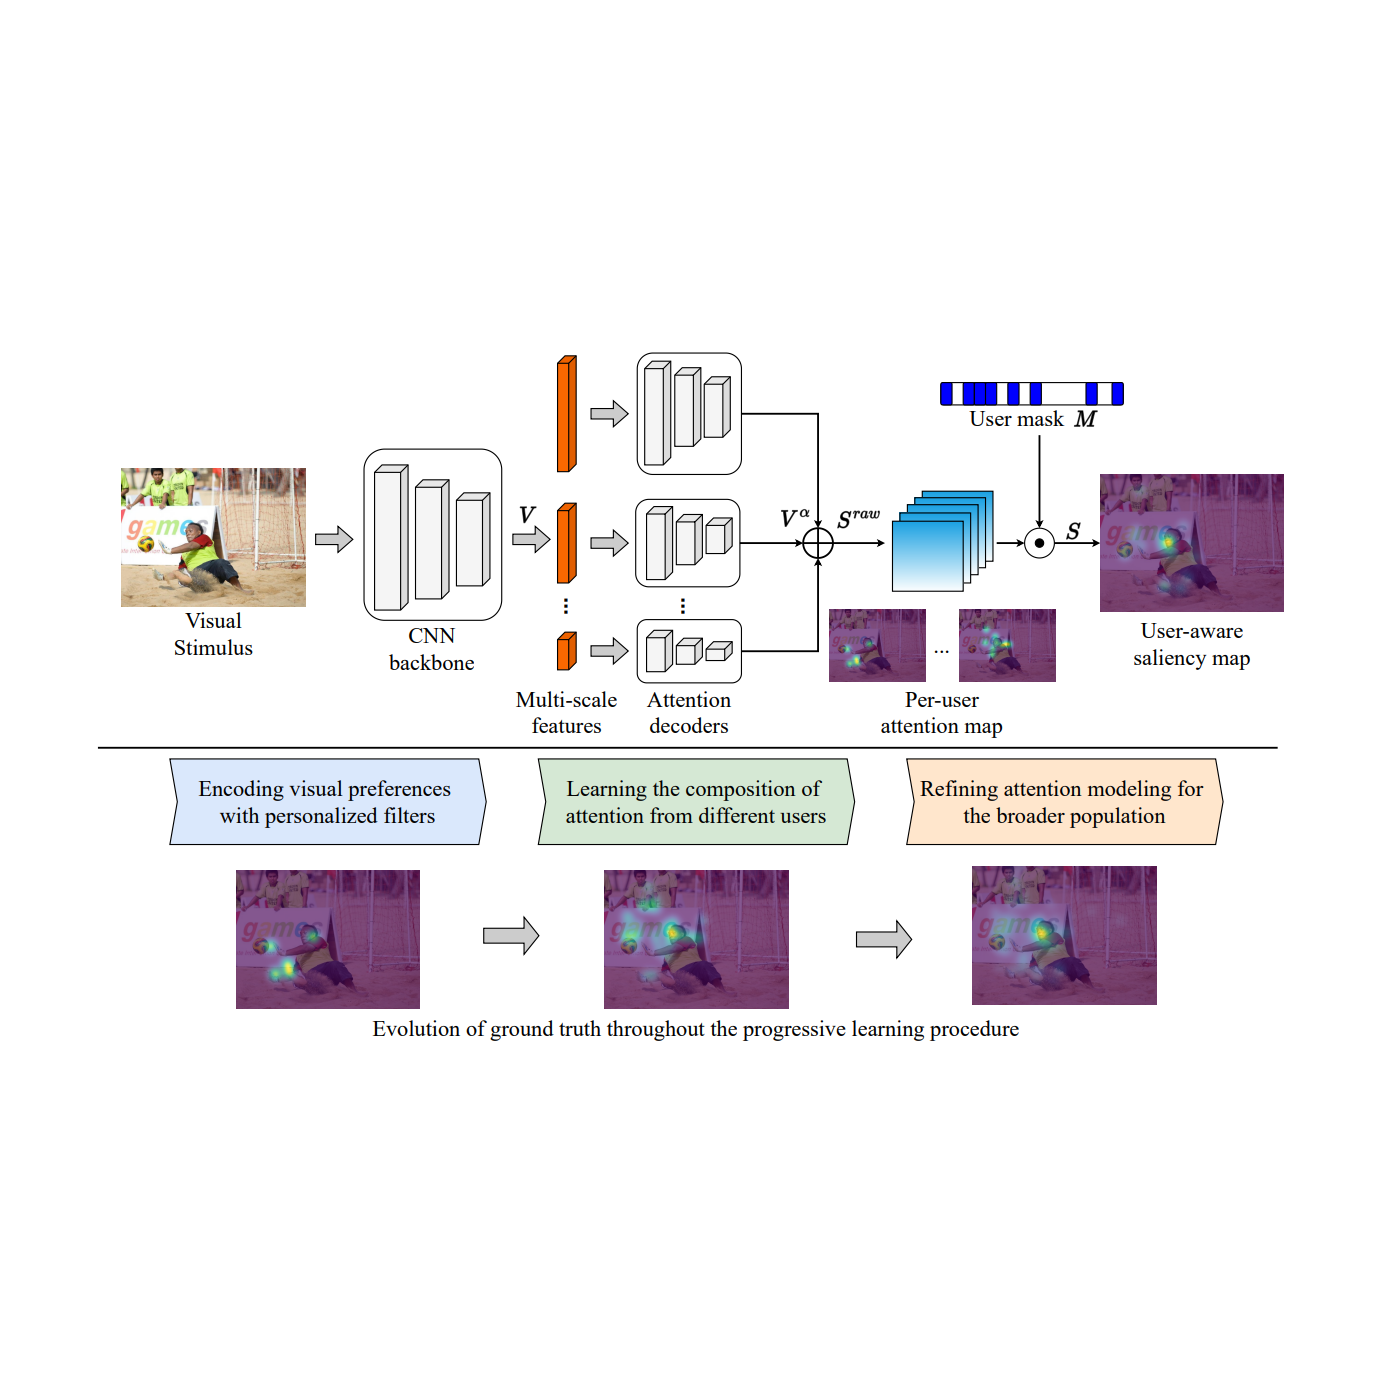
As shown in the figure below, core to the model is the combination of each participant’s visual preferences with a per-user attention map and adaptive user masks. This requires per-user attention annotations to be available in the training data, e.g., the OSIE mobile gaze dataset for natural images; FiWI and WebSaliency datasets for web pages. Instead of predicting a single saliency map representing attention of all users, this model predicts per-user attention maps to encode individuals’ attention patterns. Further, the model adopts a user mask (a binary vector with the size equal to the number of participants) to indicate the presence of participants in the current sample, which makes it possible to select a group of participants and combine their preferences into a single heatmap.
 |
| An overview of the user aware saliency model framework. The example image is from OSIE image set. |
During inference, the user mask allows making predictions for any combination of participants. In the following figure, the first two rows are attention predictions for two different groups of participants (with three people in each group) on an image. A conventional attention prediction model will predict identical attention heatmaps. Our model can distinguish the two groups (e.g., the second group pays less attention to the face and more attention to the food than the first). Similarly, the last two rows are predictions on a webpage for two distinctive participants, with our model showing different preferences (e.g., the second participant pays more attention to the left region than the first).
 |
| Predicted attention vs. ground truth (GT). EML-Net: predictions from a state-of-the-art model, which will have the same predictions for the two participants/groups. Ours: predictions from our proposed user aware saliency model, which can predict the unique preference of each participant/group correctly. The first image is from OSIE image set, and the second is from FiWI. |
Besides image editing, human attention models can also improve users’ browsing experience. One of the most frustrating and annoying user experiences while browsing is waiting for web pages with images to load, especially in conditions with low network connectivity. One way to improve the user experience in such cases is with progressive decoding of images, which decodes and displays increasingly higher-resolution image sections as data are downloaded, until the full-resolution image is ready. Progressive decoding usually proceeds in a sequential order (e.g., left to right, top to bottom). With a predictive attention model (1, 2), we can instead decode images based on saliency, making it possible to send the data necessary to display details of the most salient regions first. For example, in a portrait, bytes for the face can be prioritized over those for the out-of-focus background. Consequently, users perceive better image quality earlier and experience significantly reduced wait times. More details can be found in our open source blog posts (post 1, post 2). Thus, predictive attention models can help with image compression and faster loading of web pages with images, improve rendering for large images and streaming/VR applications.
We’ve shown how predictive models of human attention can enable delightful user experiences via applications such as image editing that can reduce clutter, distractions or artifacts in images or photos for users, and progressive image decoding that can greatly reduce the perceived waiting time for users while images are fully rendered. Our user-aware saliency model can further personalize the above applications for individual users or groups, enabling richer and more unique experiences.
Another interesting direction for predictive attention models is whether they can help improve robustness of computer vision models in tasks such as object classification or detection. For example, in “Teacher-generated spatial-attention labels boost robustness and accuracy of contrastive models”, we show that a predictive human attention model can guide contrastive learning models to achieve better representation and improve the accuracy/robustness of classification tasks (on the ImageNet and ImageNet-C datasets). Further research in this direction could enable applications such as using radiologist’s attention on medical images to improve health screening or diagnosis, or using human attention in complex driving scenarios to guide autonomous driving systems.
This work involved collaborative efforts from a multidisciplinary team of software engineers, researchers, and cross-functional contributors. We’d like to thank all the co-authors of the papers/research, including Kfir Aberman, Gamaleldin F. Elsayed, Moritz Firsching, Shi Chen, Nachiappan Valliappan, Yushi Yao, Chang Ye, Yossi Gandelsman, Inbar Mosseri, David E. Jacobes, Yael Pritch, Shaolei Shen, and Xinyu Ye. We also want to thank team members Oscar Ramirez, Venky Ramachandran and Tim Fujita for their help. Finally, we thank Vidhya Navalpakkam for her technical leadership in initiating and overseeing this body of work.
