submitted by /u/TxiskoAlonso
[visit reddit] [comments]
Categories
 DataBloom
submitted by /u/TxiskoAlonso
[visit reddit] [comments]
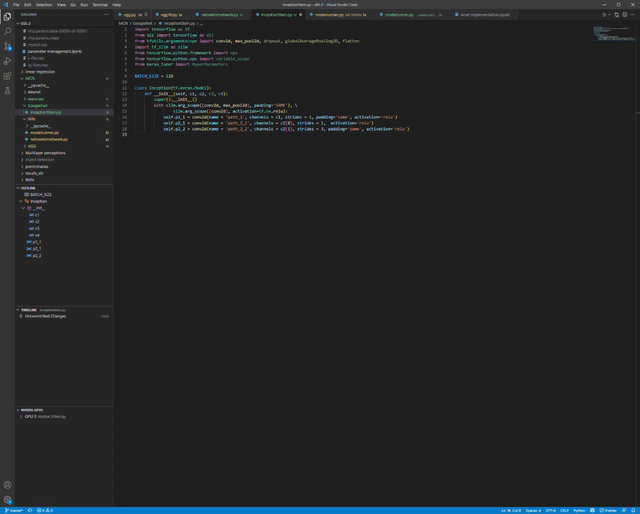
Hey there I need to rewrite this code for my project but I don’t now how to do it. Can some one help me?
from tensorflow.contrib.layers import flatten
I am trying to run this code on jupyter notebooks
submitted by /u/TxiskoAlonso
[visit reddit] [comments]
Hi All,
I’m facing a weird slowness issue when trying to use generators for creating dataset. Details : https://stackoverflow.com/questions/71459793/tensorflow-slow-processing-with-generator
Can someone from the community take a look at this generator code and help me understand what I’m doing wrong ?
def getSplit(original_list, n): return [original_list[i:i + n] for i in range(0, len(original_list), n)] # # 200 files -> 48 Mb (1 file) # 15 files in memory at a time # 5 generators # 3 files per generator # def pandasGenerator(s3files, n=3): print(f"Processing: {s3files} to : {tf.get_static_value(s3files)}") s3files = tf.get_static_value(s3files) s3files = [str(s3file)[2:-1] for s3file in s3files] batches = getSplit(s3files, n) for batch in batches: t = time.process_time() print(f"Processing Batch: {batch}") panda_ds = pd.concat([pd.read_parquet(s3file) for s3file in batch], ignore_index=True) elapsed_time = time.process_time() - t print(f"base_read_time: {elapsed_time}") for row in panda_ds.itertuples(index=False): pan_row = dict(row._asdict()) labels = pan_row.pop('label') yield dict(pan_row), labels return def createDS(s3bucket, s3prefix): s3files = getFileLists(bucket=s3bucket, prefix=s3prefix) dataset = (tf.data.Dataset.from_tensor_slices(getSplit(s3files, 40)) .interleave( lambda files: tf.data.Dataset.from_generator(pandasGenerator, output_signature=( { }, tf.TensorSpec(shape=(), dtype=tf.float64)), args=(files, 3)), num_parallel_calls=tf.data.AUTOTUNE )).prefetch(tf.data.AUTOTUNE) return dataset
submitted by /u/h1t35hv1
[visit reddit] [comments]
My interest in Reinforcement Learning is quickly turning into an obsession; that being said, the video training around TensorFlow2 Google Cert Prep seems to vary widely in content and quality.
I’ve been following along with Jose Portilla on udemy and have begun going thru the Packt Master AI books, and I’ve looked into the DeepLearning.AI TensorFlow Developer Professional Certificate course but it doesn’t look appealing.
Can anyone recommend a course that helped them learn Tensorflow2 and RL. I keep going down rabbit holes.
submitted by /u/Comfortable-Tale2992
[visit reddit] [comments]

|
submitted by /u/g00phy [visit reddit] [comments] |
What model should I use or would anyone suggest for try-on tattoos? I want the size of the try-ons to be adjustable.
submitted by /u/codamanicac
[visit reddit] [comments]
Hi! I am making a drowsiness application and have to extract eye landmarks. Can anybody help how can extract them? Kindly Help! Thank You!
submitted by /u/znoman09
[visit reddit] [comments]
I’ve a piece of code that I believe was written in TF2, but based on a repo written in TF1.
I am trying to run it in TF 1.52
It expressively invokes a piece of LSTM code that causes an error (unknown parameter “scope”)
net = tf.keras.layers.LSTM(32, return_sequences=True, dropout=0.4, recurrent_dropout=0.4)(net, scope=’lstm1′, training=is_training)
net = tf.keras.layers.LSTM(32, dropout=0.4, recurrent_dropout=0.4)(net, scope=’lstm2′, training=is_training)
All of the other layers have their scope parameter defined as part of a custom layer definition, (with tf.variable_scope(scope, reuse=reuse_weights) as sc )
Without the scope param in the LSTM layers, the kernel fails. I believe the problem is in the lack of a custom layer definition for the LSTM layers with the scope defined accordingly, but I’m not totally sure
submitted by /u/dxjustice
[visit reddit] [comments]
Hi, I am doing optical character recognition on my own dataset, consisting of around 17k images of 11 classes (0-9 as well as $). I can train the model no problem, only 2 epochs for now as loss goes down very quickly and it works perfectly immediately after training. The issue is that I try and save the model, then try and load the model, and it is like I never loaded it at all. The classifications are terrible and it barely gets 1 or 2 of the 16 images used for inference testing (completely random).
I’m sure I am doing something wrong, but I just can’t figure out what.
I’ve been following [this](https://keras.io/examples/vision/captcha_ocr/) guide from keras, and [this](https://github.com/BenSisk/CSGO-OCR) is my GitHub repo with my specific code.
submitted by /u/BoopJoop01
[visit reddit] [comments]
Question 1: As part of a project I trained a custom model from the tensorflow model Zoo found here:
Now I retrained this model from a checkpoint, so that it would look specifically at one category from the coco dataset. However, I’m wondering if the training was even needed, seeing as the model was initially trained on the coco dataset. So my question is, does retraining on the same dataset have advantages, when looking at one particular element of the dataset? (narrowing from 90 to 1 categories).
Question 2: To remedy this, I thought I might want to train a model from ‘scratch’. They provide a link in the above link to some untrained model pre-sets.
https://github.com/tensorflow/models/tree/master/research/object_detection/configs/tf2
However I noticed in the config files they link, it still says:
Trained on COCO17, initialized from Imagenet classification checkpoint
and the model config has an entry:
fine_tune_checkpoint: “PATH_TO_BE_CONFIGURED/mobilenet_v2.ckpt-1”
Can anyone explain what’s going on here and how a model can be trained ‘from scratch?’
submitted by /u/BuckyOFair
[visit reddit] [comments]