For keras, the last two releases have brought important new functionality, in terms of both low-level infrastructure and workflow enhancements. This post focuses on an outstanding example of the latter category: a new family of layers designed to help with pre-processing, data-augmentation, and feature-engineering tasks.
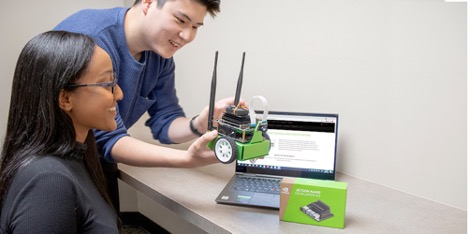 NVIDIA has partnered with iD Tech to create the Artificial Intelligence and Machine Learning certification program, a boot-camp style course for teens.
NVIDIA has partnered with iD Tech, a leading STEM educator for kids and teens, to create a brand new certification program based on the NVIDIA Jetson NanoTM. The Artificial Intelligence and Machine Learning certification program is a 10-week long, bootcamp-style virtual course for students ages 13-19 who are looking to boost their Python skills and dive into AI.
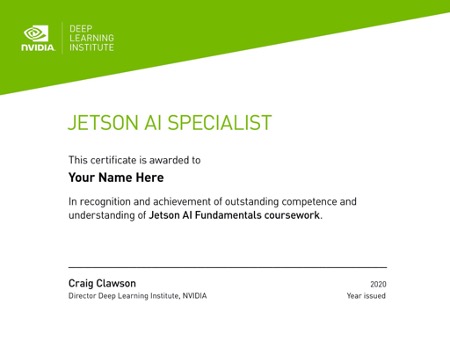
Drawing from iD Tech’s in-house Python curriculum and the NVIDIA Jetson AI Fundamentals course, students will learn key concepts in machine learning, computer vision and neural networks. Throughout the program, participants will create projects and build their personal portfolio to demonstrate their mastery of the topics. Upon successful completion of the course, students will submit their work for evaluation and a chance to earn a Jetson AI Specialist certificate from NVIDIA’s Deep Learning Institute.
The NVIDIA Foundation is providing scholarships for 30 female students to attend the course. Plus, for every 10 students who participate, an additional student will attend on full scholarship.
The inaugural class will kick off in February 2022. Learn more about the course syllabus, enrollment and scholarship opportunities.
Building AI projects to aid Alzheimer’s patients and monitor pedestrian safety might not be the typical way teens spend their summer. But that’s what a dozen teens with the Boys & Girls Clubs of Hudson County, in densely packed northeastern New Jersey, did as part of the AI Pathways Institute program. They spent three weeks Read article >
The post Forging New Pathways: Boys & Girls Clubs Teens Take AI From Idea to Application appeared first on The Official NVIDIA Blog.
 Learn a step-by-step breakdown of sorting algorithms. A fundamental tools used in data science.
Algorithms are commonplace in the world of data science and machine learning. Algorithms power social media applications, Google search results, banking systems and plenty more. Therefore, it’s paramount that Data Scientists and machine-learning practitioners have an intuition for analyzing, designing, and implementing algorithms.
Efficient algorithms have saved companies millions of dollars and reduced memory and energy consumption when applied to large-scale computational tasks. This article introduces a straightforward algorithm, Insertion Sort.
Although knowing how to implement algorithms is essential, this article also includes details of the insertion algorithm that Data Scientists should consider when selecting for utilization.Therefore, this article mentions factors such as algorithm complexity, performance, analysis, explanation, and utilization.
Why?
It’s important to remember why Data Scientists should study data structures and algorithms before going into explanation and implementation.
Data Science and ML libraries and packages abstract the complexity of commonly used algorithms. Furthermore, algorithms that take 100s of lines to code and some logical deduction are reduced to simple method invocations due to abstraction. This doesn’t relinquish the requirement for Data Scientists to study algorithm development and data structures.
When given a collection of pre-built algorithms to use, determining which algorithm is best for the situation requires understanding the fundamental algorithms in terms of parameters, performances, restrictions, and robustness. Data Scientists can learn all of this information after analyzing and, in some cases, re-implementing algorithms.
The selection of correct problem-specific algorithms and the capacity to troubleshoot algorithms are two of the most significant advantages of algorithm understanding.
K-Means, BIRCH and Mean Shift are all commonly used clustering algorithms, and by no means are Data Scientists possessing the knowledge to implement these algorithms from scratch. Still, there is a necessity that Data Scientists understand the properties of each algorithm and their suitability to specific datasets.
For example, centroid based algorithms are favorable for high-density datasets where clusters can be clearly defined. In contrast, density-based algorithms such as DBSCAN(Density-based spatial clustering of application with Noise) are preferred when dealing with a noisy dataset.
In the context of sorting algorithms, Data Scientists come across data lakes and databases where traversing through elements to identify relationships is more efficient if the containing data is sorted.
Identifying library subroutines suitable for the dataset requires an understanding of various sorting algorithms preferred data structure types. Quicksort algorithms are favorable when working with arrays, but if data is presented as linked-list, then merge sort is more performant, especially in the case of a large dataset. Still, both use the divide and conquer strategy to sort data.
Background
What’s a sorting algorithm?
The Sorting Problem is a well-known programming problem faced by Data Scientists and other software engineers. The primary purpose of the sorting problem is to arrange a set of objects in ascending or descending order. Sorting algorithms are sequential instructions executed to reorder elements within a list efficiently or array into the desired ordering.
What’s the purpose of sorting?
In the data realm, the structured organization of elements within a dataset enables the efficient traversing and quick lookup of specific elements or groups. At a macro level, applications built with efficient algorithms translate to simplicity introduced into our lives, such as navigation systems and search engines.
What’s insertion sort?
Insertion sort algorithm involves the sorted list created based on an iterative comparison of each element in the list with its adjacent element.
An index pointing at the current element indicates the position of the sort. At the beginning of the sort (index=0), the current value is compared to the adjacent value to the left. If the value is greater than the current value, no modifications are made to the list; this is also the case if the adjacent value and the current value are the same numbers.
However, if the adjacent value to the left of the current value is lesser, then the adjacent value position is moved to the left, and only stops moving to the left if the value to the left of it is lesser.
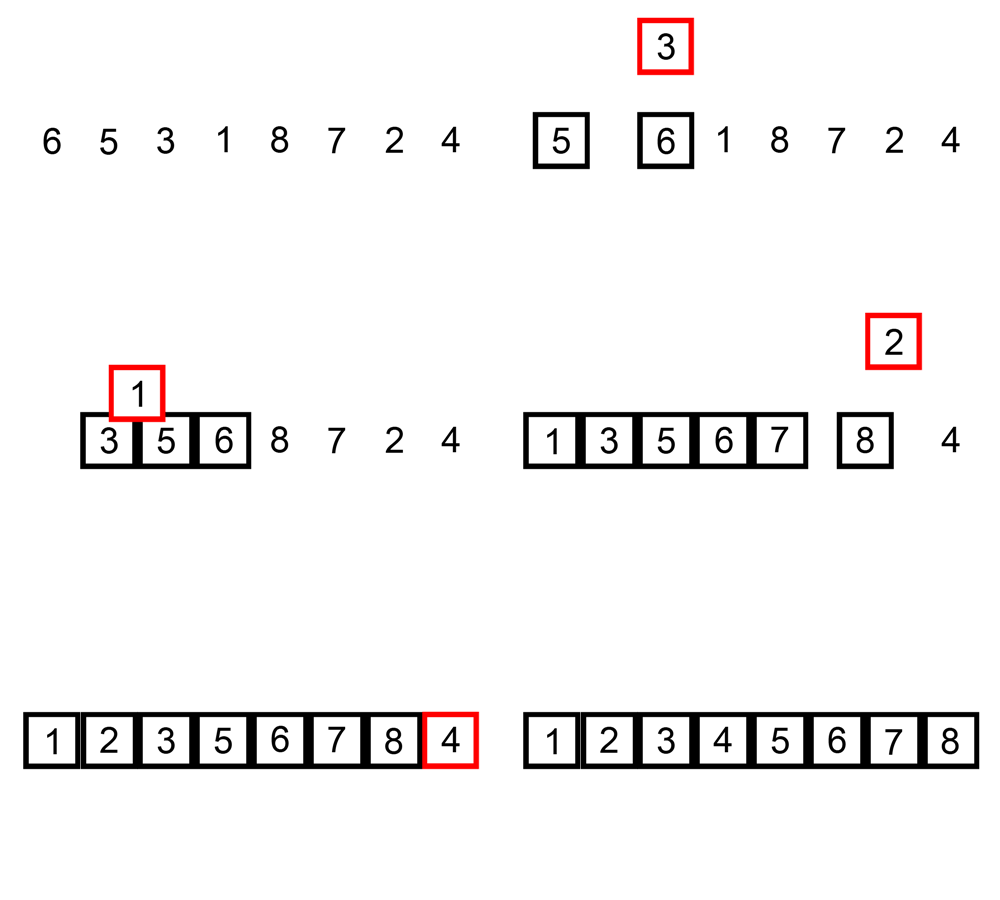
The diagram illustrates the procedures taken in the insertion algorithm on an unsorted list. The list in the diagram below is sorted in ascending order (lowest to highest).
Algorithm Steps and Implementation (Python and JavaScript)
Steps
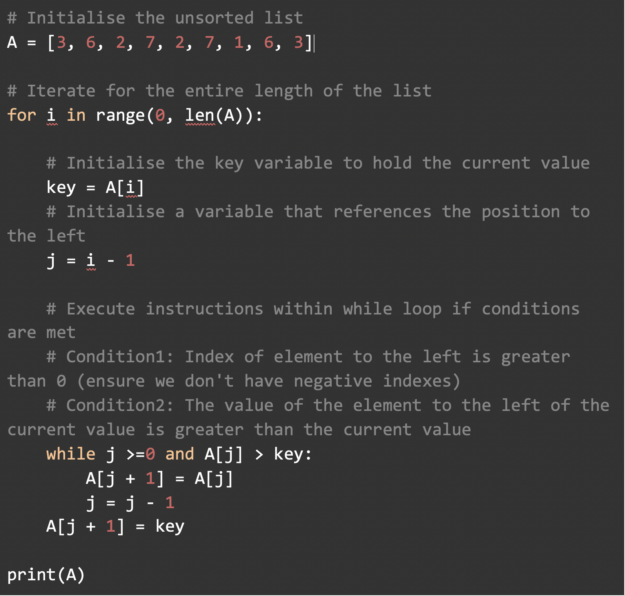
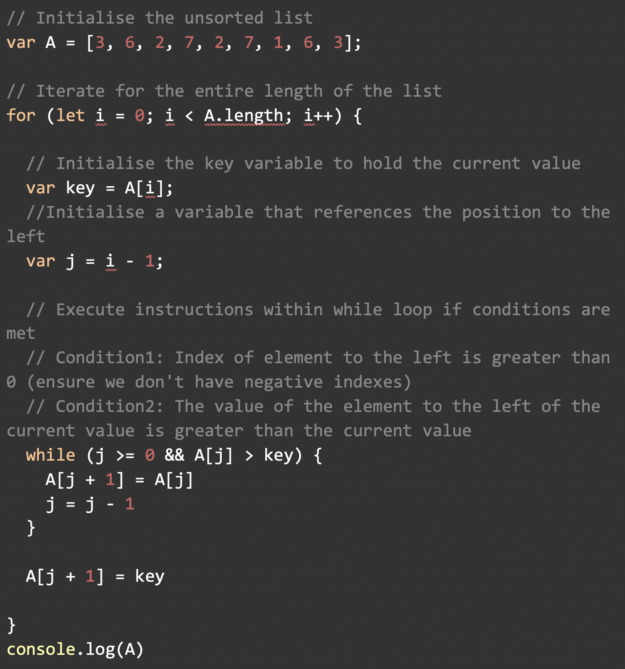
To order a list of elements in ascending order, the Insertion Sort algorithm requires the following operations:
- Begin with a list of unsorted elements.
- Iterate through the list of unsorted elements, from the first item to last.
- The current element is compared to the elements in all preceding positions to the left in each step.
- If the current element is less than any of the previously listed elements, it is moved one position to the left.
Implementation in Python
Implementation in JavaScript
Performance and Complexity
In the realm of computer science, ‘Big O notation is a strategy for measuring algorithm complexity. We won’t get too technical with Big O notation here. Still, it’s worth noting that computer scientists use this mathematical symbol to quantify algorithms according to their time and space requirements.
The Big O notation is a function that is defined in terms of the input. The letter ‘n’ often represents the size of the input to the function. Simply kept, n represents the number of elements in a list. In different scenarios, practitioners care about the worst-case, best-case, or average complexity of a function.
The worst-case (and average-case) complexity of the insertion sort algorithm is O(n²). Meaning that, in the worst case, the time taken to sort a list is proportional to the square of the number of elements in the list.
The best-case time complexity of insertion sort algorithm is O(n) time complexity. Meaning that the time taken to sort a list is proportional to the number of elements in the list; this is the case when the list is already in the correct order. There’s only one iteration in this case since the inner loop operation is trivial when the list is already in order.
Insertion sort is frequently used to arrange small lists. On the other hand, Insertion sort isn’t the most efficient method for handling large lists with numerous elements. Notably, the insertion sort algorithm is preferred when working with a linked list. And although the algorithm can be applied to data structured in an array, other sorting algorithms such as quicksort.
Summary
One of the simplest sorting methods is insertion sort, which involves building up a sorted list one element at a time. By inserting each unexamined element into the sorted list between elements that are less than it and greater than it. As demonstrated in this article, it’s a simple algorithm to grasp and apply in many languages.
By clearly describing the insertion sort algorithm, accompanied by a step-by-step breakdown of the algorithmic procedures involved. Data Scientists are better equipped to implement the insertion sort algorithm and explore other comparable sorting algorithms such as quicksort and bubble sort, and so on.
Algorithms may be a touchy subject for many Data Scientists. It may be due to the complexity of the topic. The word “algorithm” is sometimes associated with complexity. With the appropriate tools, training, and time, even the most complicated algorithms are simple to understand when you have enough time, information, and resources. Algorithms are fundamental tools used in data science and cannot be ignored.
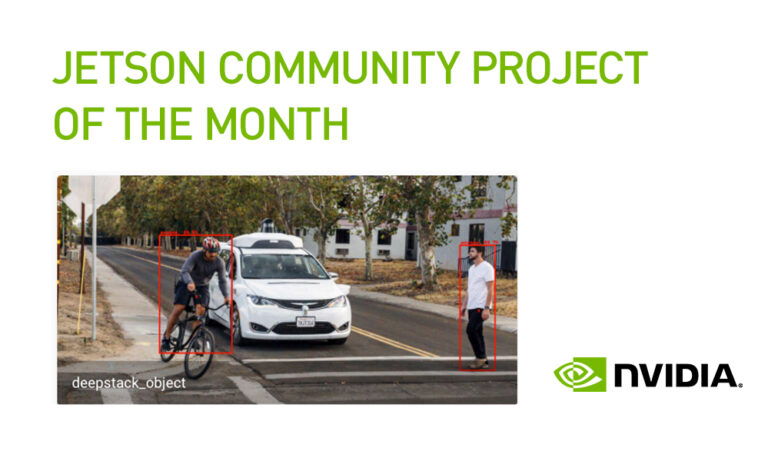 The Jetson Project of the Month simplifies home automation projects using a combination of DeepStack and Home Assistant along with the NVIDIA Jetson.
The holidays should be a time for relaxation, and with NVIDIA Jetson technology, you can do just that. The latest Jetson Project of the Month comes from a developer who has created ways to simplify home automation projects, using a combination of DeepStack, Home Assistant, and NVIDIA Jetson.
Robin Cole, a senior data scientist at Satellite Vu with a background in physics, developed this project. He has a passion for problem solving using data and Python. Cole’s main activities on GitHub involve the practical application of machine learning.
As he notes on his GitHub profile: “I have a number of personal projects around training and deploying neural networks on edge devices such as the Raspberry Pi and Jetson Nano.”
In his spare time, he is actively involved in two community projects: Home Assistant and DeepStack AI, and is exploring ways to combine the two technologies. Cole’s Jetson project integrates DeepStack object and face detection and recognition services into the popular home automation platform Home Assistant.
DeepStack runs in a Docker container and exposes various computer vision models through a REST API. DeepStack object detection can identify 80 different kinds of objects, including people, vehicles, and animals. The current list does not include sleighs or reindeer, but you can use a custom object detection model. DeepStack is free to use and it is fully open source. You will need a machine with 8GB RAM or an NVIDIA Jetson to run DeepStack.
Home Assistant is an open-source and extensible platform for home automation that can run on local embedded devices or servers while maintaining local control and privacy. It can help automate tasks such as home energy management, intelligently turning on or off the lights, or sending alerts based on entrances being open. Home Assistant can be integrated with more than 1,000 different devices.
This project uses trained models in the DeepStack REST API to send responses to Home Assistant, which can then perform tasks around the home based on this and other input. DeepStack can run on a Jetson device and it achieves good inference times on its YOLOv5-based trained models, which are run with PyTorch. The DeepStack and Home Assistant mediate their communication through a Go server and a Redis layer.
“I hope this project inspires readers to think about novel applications in and around the home and business that could benefit from AI, and enables rapid prototyping and experimentation,” Cole wrote in a forum post describing his work.
These home automation processes could be applied to tasks like monitoring the Christmas tree lights, issuing alerts when special packages are delivered to the front door, or keeping an eye on the chimney to see if a big guy in a red suit tries to sneak inside the house late at night and eat all of your cookies.
Think of it as a spin on the old holiday classic: You can keep a lookout when you’re sleeping; there’s no need to be awake. Your home automation setup can do the work, which is certainly good for goodness’ sake.
The folks at Everything Smart Home put together demos of each part of this project:
Person and face recognition
Object detection
By combining DeepStack with Home Assistant, Cole has shown developers how to create their own home security or automation systems and the ability to integrate Jetson into larger projects. For those who want to dig deeper, this project opens further possibilities to integrate other NVIDIA technologies such as DeepStream, Metropolis, or even NVIDIA Isaac with Home Assistant.
As Cole points out in his forum post about this project, the developer community is all in and finding smart ways to use this DeepStack-Home Assistant combo, including:
- Monitoring activity in a brick factory in Latin America.
- Watching for intruding snakes in Thailand.
- Monitoring parcel deliveries.
- Checking that a motorcycle is locked.
- Checking when a chicken lays an egg.
- Greeting people when they return home and playing a theme tune.
- Counting visitor numbers at a shop.
- Checking when a parking spot has become available.
The possibilities are only limited by your imagination. We still think a setup to keep tabs on Santa could be very handy. Share your ideas for how to combine DeepStack and Home Assistant with NVIDIA Jetson in the developer forums.
Cole has also been developing a custom model to detect fires using camera feeds.
Details about Cole’s projects featured in this post are available on GitHub: object detection and face recognition.
You can see a more detailed demo of Cole’s integration of DeepStack with Home Assistant in this presentation he made at IceVision earlier this year.
Learn more about using DeepStack with NVIDIA Jetson.
Get into the game quicker with the latest GeForce NOW update starting to roll out this GFN Thursday. Learn more about our latest app update — featuring Ubisoft Connect account linking for faster game launches — now rolling out to members, and the six new games joining the GeForce NOW library. The update also improves Read article >
The post Latest GeForce NOW Upgrade Rolling Out With Ubisoft Connect Account Linking and Improved PC Gaming on Mac appeared first on The Official NVIDIA Blog.
Looking for tensorflow developer
Hi guys,
Anyone here able to help with this spec? We’re looking for a tensorflow familiar app developer who can make an android app.
Mobile App Specifications
We are seeking to quickly develop a prototype Android application that
separates vocals from pop songs. The required functionality for the app is as
follows:
1. App needs to load an audio file (wav/mp3 etc) into memory.
2. A segment of audio (@12 secs in duration) will then be passed to a
tensorflow lite model to separate the audio segment into vocal audio and
non-vocal audio.
3. Another segment of audio is then taken, starting from 9 seconds after the
start of the previous segment and passed to the tensorflow lite model to
again separate the audio segment into vocal audio and non-vocal audio.
This process will be repeated until the full audio file has been processed.
4. The recovered segments need to be combined to create two complete
signals for both vocals and non-vocals. This will involve cross-fading
between the audio segments.
5. The two audio signals need to be saved to disk as audio files (wav/mp3
etc)
Notes:
1. We will supply the tensorflow lite model.
2. We can provide python code which demonstrates how the segmentation of
the audio file and cross-fading should be done.
3. As this is a prototype we are more concerned with functionality rather
than design of the UI. The only concern is that it is easy and
straightforward to load the audio file and that the saved audio files are
easy to find and access.
submitted by /u/dublinjammers
[visit reddit] [comments]
Problem in tf.keras custom metric

I tried to create my own custom metric, by subclassing the tf.keras.metrics.Metric class, by doing something similar to what is done at this Keras link.
Premise:
Before feeding data to the Neural Network, I pre-process them, by diving them for a scalar value equal to scalar=1200.0.
Thus, if I use the Mean Squared Error (MSE) metric already included in Keras, it calculates the “mse” value based on normalized data (instead of the original, de-normalized, data).
My aim is to define a “custom MSE”, in particular, an MSE calculated on de-normalized data.This is what I tried:
class custom_MSE(tf.keras.metrics.Metric): def __init__(self, name='custom_MSE', **kwargs): scalar_value = float(kwargs.pop('scalar')) super(custom_MSE, self).__init__(name=name, **kwargs) # super().__init__(name=name, **kwargs) self.mse_value = self.add_weight(name='mse_denormalized', initializer='zeros') self.scalar = scalar_value def update_state(self, y_true, y_pred, sample_weight=None) # SHAPES: y_true: (1000, 599); y_pred: (1000, 599, 1) y_true = tf.expand_dims(y_true, -1) # (1000, 599, 1) # de-normalization y_true_denorm = tf.multiply(y_true, self.scalar) # (1000, 599, 1) y_pred_denorma = tf.multiply(y_pred, self.scalar) # (1000, 599, 1) # MSE calculation squared_diff = tf.square(y_true_denorm - y_pred_denorm) # (1000, 599, 1) values = tf.reduce_mean(squared_diff) # (1000, 599, 1) self.mse_value.assign_add(tf.reduce_sum(values)) # (1000, 599, 1) def result(self): return self.mse_value def reset_states(self): self.mse_value.assign(0)
If I compile the model by using the “mse” metric which comes with Keras, by compiling the model as:
model.compile(optimizer=tf.keras.optimizers.Adam(learning_rate=0.1, beta_1=0.9, beta_2=0.99), loss="mse", metrics="mse")
I obtain “mse” values of the order of 10^-4.
Then, I tried to compile the model, by using my own “custom_mse” metric, as:
model.compile(optimizer=tf.keras.optimizers.Adam(learning_rate=0.1, beta_1=0.9, beta_2=0.99), loss="mse", metrics=custom_MSE(name="custom_MSE", maxmin="1200.0"))
Since custom_MSE = mse * (scalar)^2,
I expected to obtain “custom_mse” values of the order of 10^(-4) * (1200.0)^2 = 10^2.
Instead, I obtained “custom_mse” values insanely too big: of the order of 10^6.
Is there anyone who could see something wrong in the above tf.keras.metrics.Metric subclass?
submitted by /u/RainbowRedditForum
[visit reddit] [comments]
Scaling neural networks, whether it be the amount of training data used, the model size or the computation being utilized, has been critical for improving model quality in many real-world machine learning applications, such as computer vision, language understanding and neural machine translation. This, in turn, has motivated recent studies to scrutinize the factors that play a critical role in the success of scaling a neural model. Although increasing model capacity can be a sound approach to improve model quality, doing so presents a number of systems and software engineering challenges that must be overcome. For instance, in order to train large models that exceed the memory capacity of an accelerator, it becomes necessary to partition the weights and the computation of the model across multiple accelerators. This process of parallelization increases the network communication overhead and can result in device under-utilization. Moreover, a given algorithm for parallelization, which typically requires a significant amount of engineering effort, may not work with different model architectures.
To address these scaling challenges, we present “GSPMD: General and Scalable Parallelization for ML Computation Graphs”, in which we describe an open-source automatic parallelization system based on the XLA compiler. GSPMD is capable of scaling most deep learning network architectures and has already been applied to many deep learning models, such as GShard-M4, LaMDA, BigSSL, ViT, and MetNet-2, leading to state-of-the-art-results across several domains. GSPMD has also been integrated into multiple ML frameworks, including TensorFlow and JAX, which use XLA as a shared compiler.
Overview
GSPMD separates the task of programming an ML model from the challenge of parallelization. It allows model developers to write programs as if they were run on a single device with very high memory and computation capacity — the user simply needs to add a few lines of annotation code to a subset of critical tensors in the model code to indicate how to partition the tensors. For example, to train a large model-parallel Transformer, one may only need to annotate fewer than 10 tensors (less than 1% of all tensors in the entire computation graph), one line of additional code per tensor. Then GSPMD runs a compiler pass that determines the entire graph’s parallelization plan, and transforms it into a mathematically equivalent, parallelized computation that can be executed on each device. This allows users to focus on model building instead of parallelization implementation, and enables easy porting of existing single-device programs to run at a much larger scale.
The separation of model programming and parallelism also allows developers to minimize code duplication. With GSPMD, developers may employ different parallelism algorithms for different use cases without the need to reimplement the model. For example, the model code that powered the GShard-M4 and LaMDA models can apply a variety of parallelization strategies appropriate for different models and cluster sizes with the same model implementation. Similarly, by applying GSPMD, the BigSSL large speech models can share the same implementation with previous smaller models.
Generality and Flexibility
Because different model architectures may be better suited to different parallelization strategies, GSPMD is designed to support a large variety of parallelism algorithms appropriate for different use cases. For example, with smaller models that fit within the memory of a single accelerator, data parallelism is preferred, in which devices train the same model using different input data. In contrast, models that are larger than a single accelerator’s memory capacity are better suited for a pipelining algorithm (like that employed by GPipe) that partitions the model into multiple, sequential stages, or operator-level parallelism (e.g., Mesh-TensorFlow), in which individual computation operators in the model are split into smaller, parallel operators.
GSPMD supports all the above parallelization algorithms with a uniform abstraction and implementation. Moreover, GSPMD supports nested patterns of parallelism. For example, it can be used to partition models into individual pipeline stages, each of which can be further partitioned using operator-level parallelism.
GSPMD also facilitates innovation on parallelism algorithms by allowing performance experts to focus on algorithms that best utilize the hardware, instead of the implementation that involves lots of cross-device communications. For example, for large Transformer models, we found a novel operator-level parallelism algorithm that partitions multiple dimensions of tensors on a 2D mesh of devices. It reduces peak accelerator memory usage linearly with the number of training devices, while maintaining a high utilization of accelerator compute due to its balanced data distribution over multiple dimensions.
To illustrate this, consider a simplified feedforward layer in a Transformer model that has been annotated in the above way. To execute the first matrix multiply on fully partitioned input data, GSPMD applies an MPI-style AllGather communication operator to partially merge with partitioned data from another device. It then executes the matrix multiply locally and produces a partitioned result. Before the second matrix multiply, GSPMD adds another AllGather on the right-hand side input, and executes the matrix multiply locally, yielding intermediate results that will then need to be combined and partitioned. For this, GSPMD adds an MPI-style ReduceScatter communication operator that accumulates and partitions these intermediate results. While the tensors generated with the AllGather operator at each stage are larger than the original partition size, they are short-lived and the corresponding memory buffers will be freed after use, which does not affect peak memory usage in training.
A Transformer Example with Nested Parallelism
As a shared, robust mechanism for different parallelism modes, GSPMD allows users to conveniently switch between modes in different parts of a model. This is particularly valuable for models that may have different components with distinct performance characteristics, for example, multimodal models that handle both images and audio. Consider a model with the Transformer encoder-decoder architecture, which has an embedding layer, an encoder stack with Mixture-of-Expert layers, a decoder stack with dense feedforward layers, and a final softmax layer. In GSPMD, a complex combination of several parallelism modes that treats each layer separately can be achieved with simple configurations.
In the figure below, we show a partitioning strategy over 16 devices organized as a logical 4×4 mesh. Blue represents partitioning along the first mesh dimension X, and yellow represents partitioning along the second mesh dimension Y. X and Y are repurposed for different model components to achieve different parallelism modes. For example, the X dimension is used for data parallelism in the embedding and softmax layers, but used for pipeline parallelism in the encoder and decoder. The Y dimension is also used in different ways to partition the vocabulary, batch or model expert dimensions.
 |
Computation Efficiency
GSPMD provides industry-leading performance in large model training. Parallel models require extra communication to coordinate multiple devices to do the computation. So parallel model efficiency can be estimated by examining the fraction of time spent on communication overhead — the higher percentage utilization and the less time spent on communication, the better. In the recent MLPerf set of performance benchmarks, a BERT-like encoder-only model with ~500 billion parameters to which we applied GSPMD for parallelization over 2048 TPU-V4 chips yielded highly competitive results (see table below), utilizing up to 63% of the peak FLOPS that the TPU-V4s offer. We also provide efficiency benchmarks for some representative large models in the table below. These example model configs are open sourced in the Lingvo framework along with instructions to run them on Google Cloud. More benchmark results can be found in the experiment section of our paper.
| Model Family | Parameter Count | % of model activated* | No. of Experts** | No. of Layers | No. of TPU | FLOPS utilization |
| Dense Decoder (LaMDA) | 137B | 100% | 1 | 64 | 1024 TPUv3 | 56.5% |
| Dense Encoder (MLPerf-Bert) | 480B | 100% | 1 | 64 | 2048 TPUv4 | 63% |
| Sparsely Activated Encoder-Decoder (GShard-M4) | 577B | 0.25% | 2048 | 32 | 1024 TPUv3 | 46.8% |
| Sparsely Activated Decoder | 1.2T | 8% | 64 | 64 | 1024 TPUv3 | 53.8% |
| *The fraction of the model activated during inference, which is a measure of model sparsity. **Number of experts included in the Mixture of Experts layer. A value of 1 corresponds to a standard Transformer, without a Mixture of Experts layer. |
Conclusion
The ongoing development and success of many useful machine learning applications, such as NLP, speech recognition, machine translation, and autonomous driving, depend on achieving the highest accuracy possible. As this often requires building larger and even more complex models, we are pleased to share the GSPMD paper and the corresponding open-source library to the broader research community, and we hope it is useful for efficient training of large-scale deep neural networks.
Acknowledgements
We wish to thank Claire Cui, Zhifeng Chen, Yonghui Wu, Naveen Kumar, Macduff Hughes, Zoubin Ghahramani and Jeff Dean for their support and invaluable input. Special thanks to our collaborators Dmitry Lepikhin, HyoukJoong Lee, Dehao Chen, Orhan Firat, Maxim Krikun, Blake Hechtman, Rahul Joshi, Andy Li, Tao Wang, Marcello Maggioni, David Majnemer, Noam Shazeer, Ankur Bapna, Sneha Kudugunta, Quoc Le, Mia Chen, Shibo Wang, Jinliang Wei, Ruoming Pang, Zongwei Zhou, David So, Yanqi Zhou, Ben Lee, Jonathan Shen, James Qin, Yu Zhang, Wei Han, Anmol Gulati, Laurent El Shafey, Andrew Dai, Kun Zhang, Nan Du, James Bradbury, Matthew Johnson, Anselm Levskaya, Skye Wanderman-Milne, and Qiao Zhang for helpful discussions and inspirations.
With their marbled counters, neoclassical oven alcove and iconic bouquets of spatulas, the “kitchen keynotes” delivered by NVIDIA founder and CEO Jensen Huang during pandemic-era GTCs have been a memorable setting for the highly anticipated events. The keynotes were initially delivered from his real kitchen, in response to workplace closures. But last spring, the kitchen Read article >
The post Artisan Baking: How Creators Worldwide Cooked Up GTC Keynote’s Virtual Kitchen appeared first on The Official NVIDIA Blog.

