
 NVIDIA Optical Flow SDK exposes the APIs to use this Optical Flow hardware (also referred to as NVOFA) to accelerate applications.
The NVIDIA Turing architecture introduced a new hardware functionality for computing optical flow between a pair of images with very high performance. NVIDIA Optical Flow SDK exposes the APIs to use this Optical Flow hardware (also referred to as NVOFA) to accelerate applications. We are excited to announce the availability of Optical Flow SDK 3.0 with the following new features:
- DirectX 12 Optical Flow API
- Forward-Backward Optical Flow via a single API
- Global Flow vector
DirectX 12 Optical Flow API
DirectX 12 is a low-level programming API from Microsoft which reduces driver overhead in comparison to its predecessor DirectX 11. DirectX 12 provides more flexibility and fine-grained control to the developer. Developers can now take advantage of the low-level programming APIs in DirectX 12 and optimize their applications to give better performance over earlier DirectX versions – at the same time, the client application, on its own, must take care of resource management, synchronization, etc. DirectX 12 has rapidly grown amongst game titles and other graphics applications.
Optical Flow SDK 3.0 enables DirectX 12 applications to use the NVIDIA Optical Flow engine. The computed optical flow can be used to increase frame rate in games and videos for smoother experience or in object tracking. To increase the frame rate, Frame Rate Up Conversion (FRUC) techniques are used by inserting interpolated frames between original frames. Interpolation algorithms use the flow between frame pair(s) to generate the intermediate frame.
All generations of Optical Flow Hardware support DirectX 12 Optical Flow interface. The Optical Flow SDK package contains header(s), sample applications that demonstrate the usage, C++ wrapper classes which can be re-used or modified as required and documentation. All the other components for accessing the Optical Flow hardware are included in the NVIDIA display driver. DirectX 12 Optical Flow API is supported on Windows 20H1 or later operating system.
Barring the explicit synchronization, DirectX 12 Optical Flow API is designed to be close to the other interfaces that are already available in the SDK (CUDA and DirectX 11). The DirectX 12 Optical Flow API consists of three core functions: initialization, flow estimation and destruction.
typedef NV_OF_STATUS(NVOFAPI* PFNNVOFINIT) (NvOFHandle hOf, const NV_OF_INIT_PARAMS* initParams);

typedef NV_OF_STATUS(NVOFAPI* PFNNVOFEXECUTED3D12) (NvOFHandle hOf, const NV_OF_EXECUTE_INPUT_PARAMS_D3D12* executeInParams, NV_OF_EXECUTE_OUTPUT_PARAMS_D3D12* executeOutParams);

typedef NV_OF_STATUS(NVOFAPI* PFNNVOFDESTROY) (NvOFHandle hOf);
Initialization and destroy APIs are same across all interfaces but Execute API differs between DirectX 12 and other interfaces i.e., DirectX 11 and CUDA. Even though most of the parameters passed to the Execute API in DirectX 12 are same as those in other two interfaces, there are some functional differences. Synchronization in DirectX 11 and CUDA interfaces is automatically taken care by OS runtime and driver. However, in DirectX 12, additional information about fence and fence values are required as input parameters to the Execute API. These fence objects will be used to synchronize the CPU GPU and GPUGPU operations. For more details, please refer to the programming guide included with the Optical Flow SDK.
Buffer management API interface in DirectX 12 also needs fence objects for synchronization.
The Optical Flow output quality is same across all interfaces. Performance in DirectX 12 should be very close compared to the other two interfaces.
Forward-Backward Optical Flow (FB flow)
No Optical Flow algorithm can give 100% accurate flow. The flow is typically distorted in occluded regions. Sometimes, the cost provided by the NVOFA may not also represent true confidence of the flow. One simple check usually employed is to compare the forward and backward flow. If the Euclidean distance between forward flow and backward flow exceeds a threshold, the flow can be marked as invalid.
To estimate flow in both directions, client must call the Execute API twice: one call with input and reference images and second call after reversing the input and reference images. Calling the Optical Flow Execute API two times like this can result in suboptimal performance due to overheads such as context switching, thread switching etc. Optical Flow SDK 3.0 exposes a new API to generate flow in both directions in a single Execute call. This feature can be enabled by setting NV_OF_INIT_PARAMS::predDirection to NV_OF_PRED_DIRECTION_BOTH in initialization and providing necessary buffers to receive backward flow and/or cost in NV_OF_EXECUTE_OUTPUT_PARAMS/NV_OF_EXECUTE_OUTPUT_PARAMS_D3D12::bwdOutputBuffer, NV_OF_EXECUTE_OUTPUT_PARAMS/NV_OF_EXECUTE_OUTPUT_PARAMS_D3D12::bwdOutputCostBuffer.
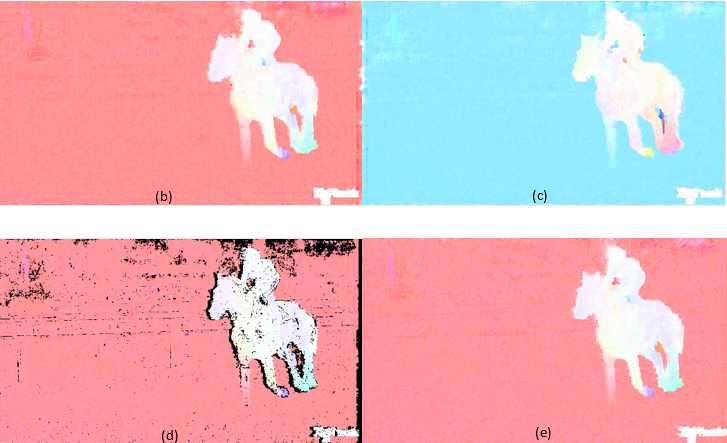
Once the flow is generated in both directions, client application can compare the flow vectors of both directions, discard the inaccurate ones based on a suitable criteria (e.g. Euclidian distance between forward and backward flow vectors), and use hole filling algorithms to fill such discarded flow vectors.
Note that the output quality of FB flow could be different from unidirectional flow due to some optimizations.
Sample code that demonstrates FB flow API programming and consistency check:
// Initialization of API
NV_OF_INIT_PARAMS initParams = { 0 };
...
initParams.predDirection = NV_OF_PRED_DIRECTION_BOTH;
...
NvOFAPI->nvOFInit(hNvOF, &initParams);
// Estimation of forward and backward flow
NV_OF_EXECUTE_INPUT_PARAMS executeInParams = { 0 };
...
NV_OF_EXECUTE_OUTPUT_PARAMS executeOutParams = { 0 };
...
executeOutParams.outputBuffer = forwardFlowBuffer;
executeOutParams.outputCostBuffer = forwardFlowCostBuffer;
executeOutParams.bwdOutputBuffer = backwardFlowBuffer;
executeOutParams.bwdOutputCostBuffer = backwardFlowCostBuffer;

NvOFAPI->nvOFExecute(hNvOF, &executeInparams, &executeOutParams)


// Invalidating flow vectors
for (int y = 0; y  width - 1 || y2  thresh) {
            SetFlowInvalid(forwardFlowBuffer, x, y);
        }
    }
}
Global Flow Estimation
Global flow in a video sequence or game is caused by camera panning motion. Global flow estimation is an important tool widely used in image segmentation, video stitching or motion-based video analysis applications.
Global Flow vector can also be heuristically used in calculating background motion. Once background motion is estimated, this can be used to fill the flow vectors in occluded regions. It can also be used to handle collisions of warped pixels in interpolated frames.
Global flow is calculated on the forward flow vectors, based on frequency of the occurrence and a few other heuristics.
To enable generation of global flow, initialization API needs to set the flag NV_OF_INIT_PARAMS:: enableGlobalFlow and provide the additional buffer NV_OF_EXECUTE_OUTPUT_PARAMS/NV_OF_EXECUTE_OUTPUT_PARAMS_D3D12::globalFlowBuffer in Execute API.
References
- NVIDIA Optical Flow SDK
- Developer Blog: An Introduction to the NVIDIA Optical Flow SDK
- Developer Blog: Accelerate OpenCV: Optical Flow Algorithms with NVIDIA Turing GPUs
 Hosted by the Department of Veterans Affairs (VA), the sprint is designed to foster collaboration with industry and academic partners on AI-enabled tools that leverage federal data to address a need for veterans.
 Targeting areas populated with disease-carrying mosquitoes just got easier thanks to a new study. The research, recently published in IEEE Explore, uses deep learning to recognize tiger mosquitoes from images taken by citizen scientists with near perfect accuracy. “Identifying the mosquitoes is fundamental, as the diseases they transmit continue to be a major public health …


 Developers can use the new viisights wise application powered by GPU-accelerated AI technologies to help organizations and municipalities worldwide avoid operational hazards and risk in their most valuable spaces.
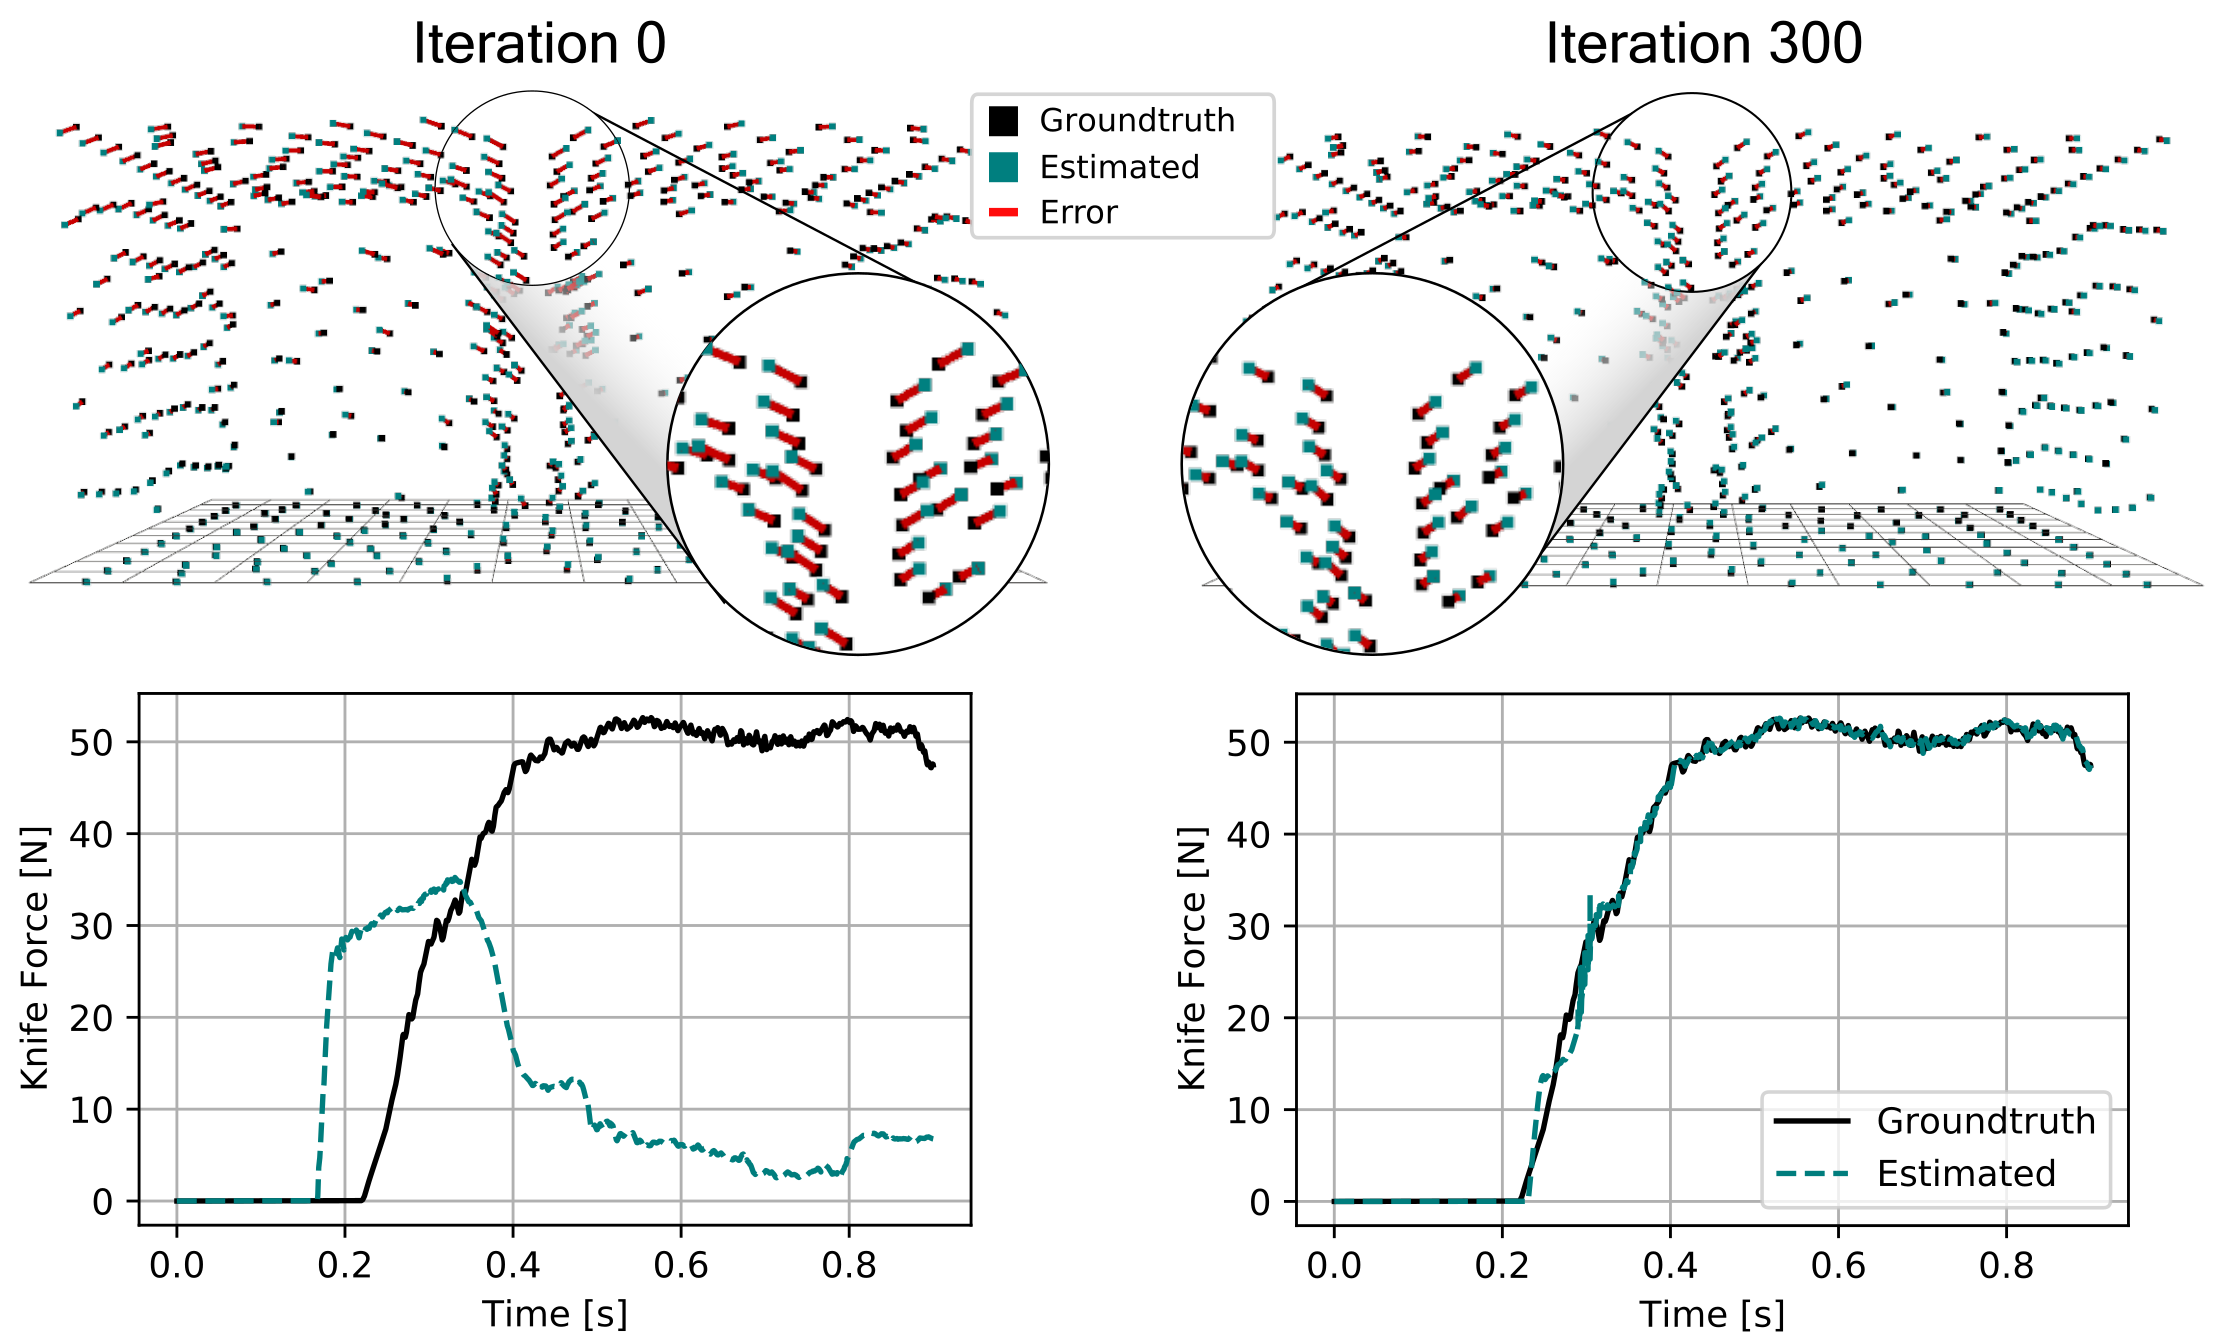
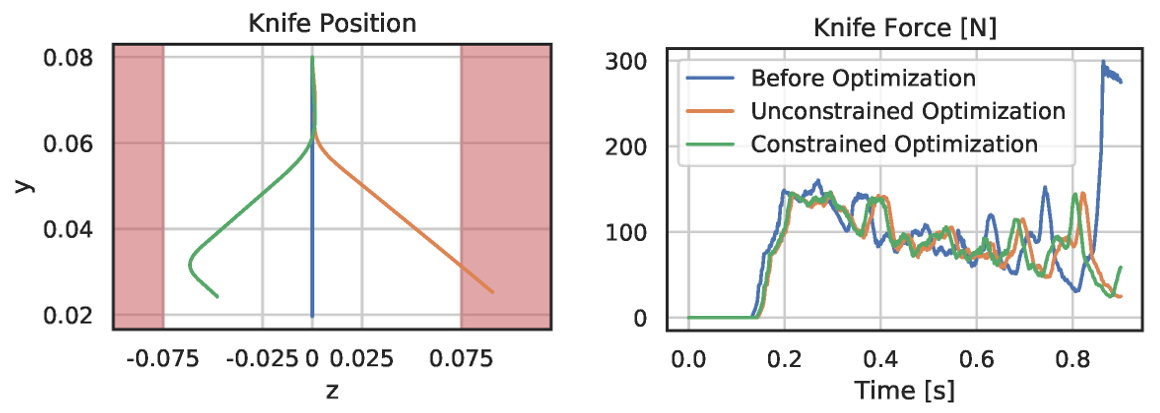
  Robotics researchers from NVIDIA and University of Southern California recently presented their work at the 2021 RSS conference called DiSECt, the first differentiable simulator for robotic cutting.
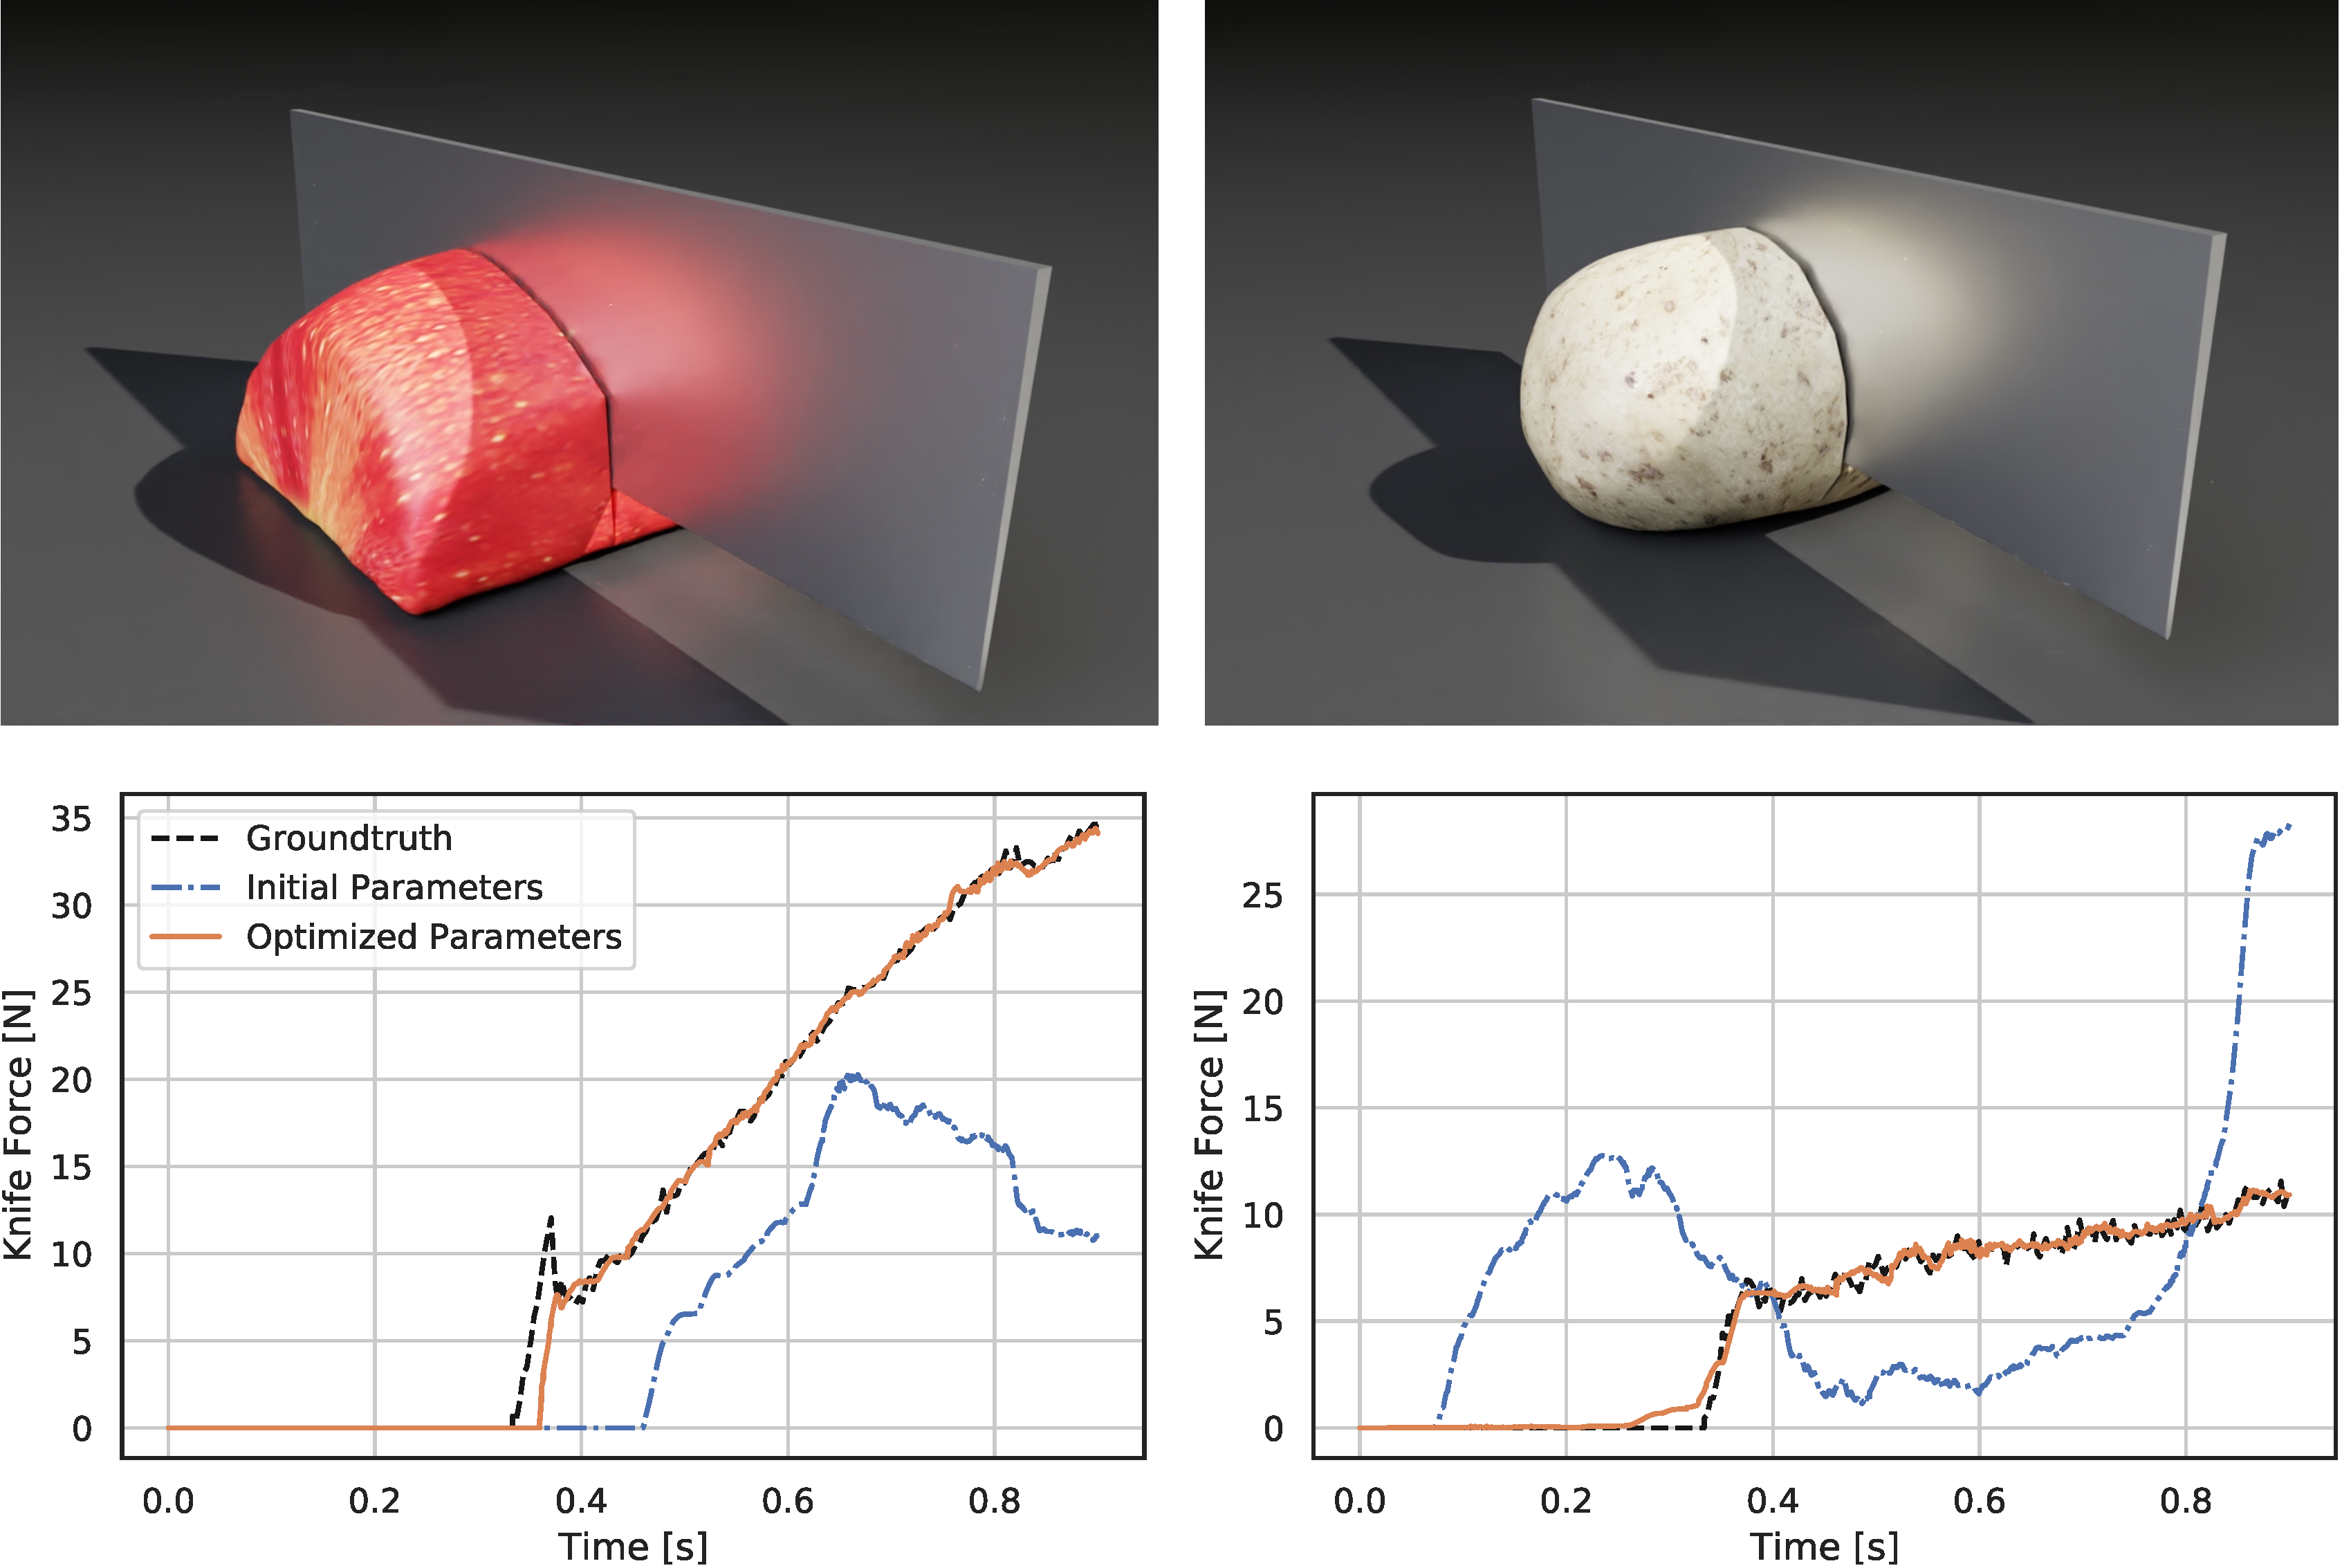


