
 Learn how the use of RAPIDS to accelerate the analysis of single-cell RNA-sequence on a single NVIDIA V100 GPU shows a massive performance increase.
Single-cell genomics research continues to advance drug discovery for disease prevention. For example, it has been pivotal in developing treatments for the current COVID-19 pandemic, identifying cells susceptible to infection, and revealing changes in the immune systems of infected patients. However, with the growing availability of large-scale single-cell datasets, it’s clear that computing inefficiencies are significantly impacting the speed at which science is done. Offloading these compute bottlenecks to the GPU has demonstrated intriguing results.
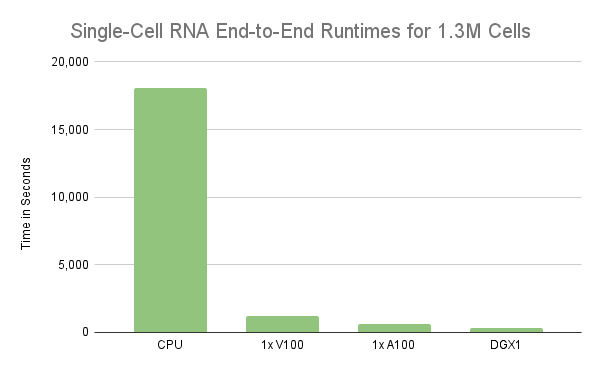
In a recent blog post, NVIDIA benchmarked the analysis on one million mouse brain cells sequenced by 10X Genomics. Results demonstrated that the end-to-end workflow took over three hours to run on a GCP CPU instance while the entire dataset was processed in 11 minutes on a single NVIDIA V100 GPU. In addition, running the RAPIDS analysis on the GCP GPU instance also costs 3x less than the CPU version. Read the blog here.
Follow this Jupyter notebook for RAPIDS analysis of this dataset. For the notebook to run, the files rapids_scanpy_funcs.py and utils.py must be in the same folder as the notebook. We provide a second notebook with the CPU version of this analysis here. In collaboration with the Google Dataproc team, we’ve built out a getting started guide to help developers run this trascriptomics use case quickly. Finally, check out this NVIDIA and Google Cloud co-authored blog post that showcases the impact of the work.
Performing single-cell RNA analysis on the GPU
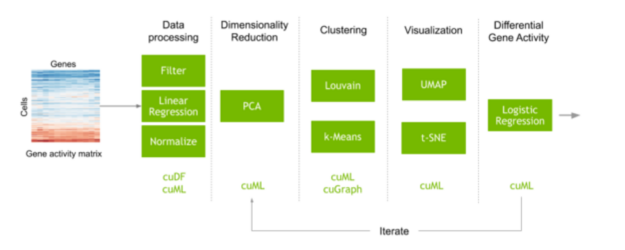
A typical workflow to perform single-cell analysis often begins with a matrix that maps the counts of each gene script measured in each cell. Preprocessing steps are performed to filter out noise, and the data are normalized to obtain expressions of every gene measured in every individual cell of the dataset. Machine learning is also commonly used in this step to correct unwanted artifacts from data collection. The number of genes can often be quite large, which can create many different variations and add a lot of noise when computing similarities between the cells. Feature selection and dimensionality reduction decrease this noise before identifying and visualizing clusters of cells with similar gene expression. The transcript expression of these cell clusters can also be compared to understand why different types of cells behave and respond differently.
The analysis demonstrates the use of RAPIDS to accelerate the analysis of single-cell RNA-sequence data from 1 million cells using a single GPU. However, the experiment only processed the first 1M cells, not the entire 1.3M cells. As a result, processing all 1.3M cells in a workflow for single-cell RNA data took almost twice the time on a single V100 GPU. On the other hand, the same workflow took only 11 minutes on a single NVIDIA A100 40GB GPU. Unfortunately, the nearly 2x degradation in performance on the V100 is due mainly to the ability to oversubscribe the GPU’s memory so that it spills to host memory when needed. We will cover this behavior in more detail in the following section, but what’s clear is that the GPU’s memory is a limiting factor to scale. So, processing larger workloads faster requires beefier GPUs like the A100 or/and spreading the processing over multiple GPUs.
Benefits of scaling preprocessing to multiple GPUs
When a workflow’s memory usage grows beyond the capacity of a single GPU, unified virtual memory (UVM) can be used to oversubscribe the GPU and automatically spill to main memory. This approach can be advantageous during the exploratory data analysis process because moderate oversubscription ratios can eliminate the need to rerun a workflow when the GPU runs out of memory.
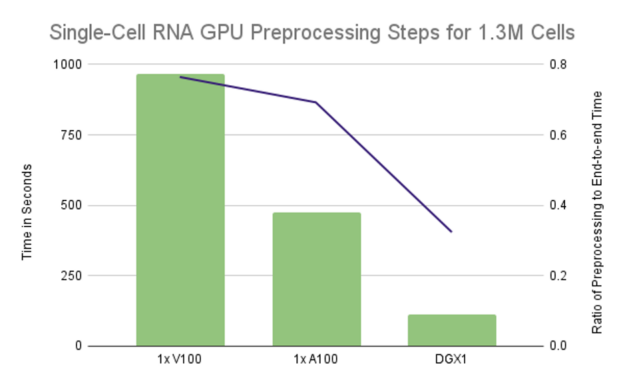
However, relying strictly on UVM to oversubscribe a GPU’s memory by 2x or more can lead to poor performance. Even worse, it can cause the execution to hang indefinitely when any single computation requires more memory than is available on the GPU. Spreading computation across multiple GPUs affords the benefit of both increased parallelism and reduced memory footprint on each GPU. In some cases, it may eliminate the need for oversubscription. Figure 2 demonstrates that we can achieve linear scaling by spreading the preprocessing computations across multiple GPUs, with 8 GPUs resulting in slightly over 8x speedup compared to a single NVIDIA V100 GPU. Putting that into perspective, it takes less than 2 minutes to reduce the dataset of 1.3M cells and 18k genes down to approximately 1.29M cells and the 4k most highly variable genes on 8 GPUs. That’s over an 8.55x speedup as a single V100 took over 16 minutes to run the same preprocessing steps.
Scaling single-cell RNA notebooks to multiple GPUs with Dask and RAPIDS
Many preprocessing steps, such as loading the dataset, filtering noisy transcripts and cells, normalizing counts into expressions, and feature selection, are inherently parallel, leaving each GPU independently responsible for its subset. A common step that corrects the noisy effects of data collection uses proportions of contributions from unwanted genes, such as ribosomal genes, and fits many small linear regression models, one for each transcript in the dataset. Since the number of transcripts can often be in the tens of thousands, only a few thousand of the top best-represented genes are often selected, using a measure of dispersion or variability.
Dask is an excellent library for distributing data processing workflows over a set of workers. RAPIDS has enabled Dask to also use GPUs by mapping each worker process to their own GPU. In addition, Dask provides a distributed array object, much like a distributed version of a NumPy array (or CuPy, its GPU-accelerated look-alike), which allows users to distribute the steps for the above preprocessing operations on multiple GPUs, even across multiple physical machines, manipulating and transforming the data in much the same way we would a NumPy or CuPy array.
After preprocessing, we also distribute the Principal Components Analysis (PCA) reduction step by training on a subset of the data and distributing the inference, lowering the communication cost by bringing only the first 50 principal components back to a single GPU for the remaining clustering and visualization steps. The PCA-reduced matrix of cells is only 260 MB for this dataset, allowing the remaining clustering and visualization steps to be performed on a single GPU. With this design, even a dataset containing 5M cells would only require 1 GB of memory.
Conclusion
At the rate in which our computational tools are advancing, we can assume it won’t be long before the data processing volumes catch up, especially for single-cell analysis workloads, forcing the need to scale ever higher. In the meantime, there are still opportunities to decrease the iteration times of the exploratory data analysis process even further by distributing the clustering and visualization steps over multiple GPUs. Faster iteration means better models, reduced time to insight, and more informed results. Except for T-SNE, all of the clustering and visualization steps of the multi-GPU workflow notebook can already be distributed over Dask workers on GPUs with RAPIDS cuML and cuGraph.