
 When you see a context-relevant advertisement on a web page, it’s most likely content served by a Taboola data pipeline. As the leading content recommendation…
When you see a context-relevant advertisement on a web page, it’s most likely content served by a Taboola data pipeline. As the leading content recommendation company in the world, a big challenge for Taboola was the frequent need to scale Apache Spark CPU cluster capacity to address the constantly growing compute and storage requirements.
Data center capacity and hardware costs are always under pressure.
What caused the scaling challenges? Taboola uses a complex data pipeline stretching from user browsers or mobile devices through multiple data centers. Complex deep learning algorithms, databases, infrastructure services (such as Apache Kafka), and thousands of servers are deployed to serve the best-fitting ads to users around the world.
This post describes Taboola’s motivation to move to RAPIDS Accelerator for Apache Spark to optimize processing costs, along with insights on the migration process, challenges, and lessons learned to date.
Challenges of feeding a compute-hungry pipeline
To plan solutions, you must fully understand the magnitude of the problem. When serving ad content, Taboola builds a unique pageview that identifies each user and their interaction with the system. The pageview, a large, wide data structure, is built within a massive CPU cluster using data collected across worldwide data centers. The structure contains over 1500 distinct columns amounting to >1 TB of hourly data, all processed in our Apache Spark CPU cluster.
Many distinct analyzers and SQL queries process incoming pageviews at a rate of 1 TB of raw data per hour and catchup runs at 2, 6, 12, and 48 hours. New analyzers are constantly being created that increase the load on the Apache Spark cluster. There is a growing need for more compute power.
Our main task was to make the complex compute-hungry pipeline more scalable while being cost-effective. To address this challenge, Taboola embarked on an effort to migrate thousands of CPU cores to GPUs, to help us cope with the increasing data load to be processed.
One tool we considered to accelerate Taboola’s Apache Spark environments was the RAPIDS Accelerator on GPUs. As such, it was a natural decision to attempt greater scalability on GPUs as opposed to CPUs.
Key considerations
First, we defined what we needed for testing to successfully migrate thousands of CPU cores to leverage GPU acceleration:
- Real-life dataset
- Hardware specifications
- Minimum X factor
- Complex query testing
Real-life dataset
We used real production data from Cyber Monday to test and benchmark a large dataset. The data is 1.5 TB of ZSTD-compressed Parquet files per hour. It has over 1500 columns of all native types including arrays, structures, and nested structures with arrays.
Hardware specifications
For hardware, we started with the following resources:
- A 72 CPU core Intel server with three A30 GPUs
- A 900-GB local SSD drive, for Apache Spark to store its intermediate files
- 380 GB RAM
- A 10-Gb/s NIC card
Minimum X factor
The primary question when migrating a project from the CPU to the GPU is usually, “What’s the X factor?” For a real-world cluster with multiple GPUs, the question is, “How many GPUs do I need for sustaining a load manageable by X CPU cores?” The answer is your X factor.
We set a minimum bar of an X factor of 3 for the GPU solution to be considered successful in terms of cost. This factor helps guarantee our migration efforts will pay off.
Complex query testing
We picked 15 queries from production across multiple R&D departments to resemble as many of the hundreds of queries as are in production.
The queries are mostly complex including many SQL operations:
- Aggregations
- Sorts
- Lateral view explode
- Distribute by
- Window functions
- UDFS
Figure 1 shows an example query.
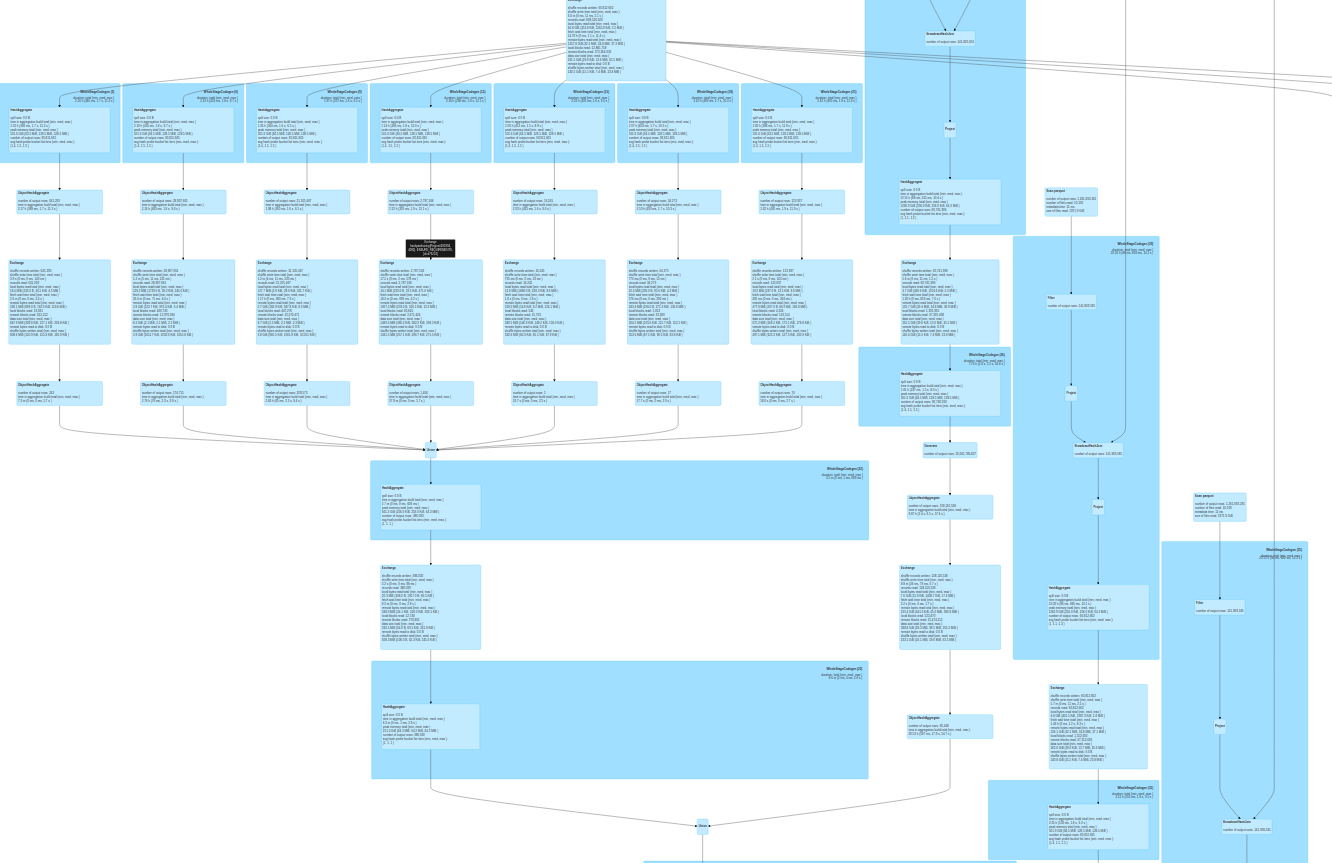
Table 1 shows you Taboola’s factors.
| Analyzer name | Avg CPU production time | Avg GPU time | GPU factor |
| AdvertiserDimensionByRequest | 586.41 | 31.91 | 18.38 |
| ExperiementAnalysisPage | 3021.6 | 102.92 | 29.36 |
| ExperiementAnalysisPlacement | 680.84 | 47.12 | 14.45 |
| ExperimentAnalysisRequestBase | 6605.44 | 362.68 | 18.21 |
| ExperimentAnalysisSession | 207.87 | 23.01 | 9.03 |
| MediaDatatrendsBase | 222.94 | 9.8 | 22.75 |
| PerformanceMeasurements | 397.17 | 86.22 | 4.61 |
| PublisherPerformance | 965.63 | 108.95 | 8.86 |
| RBoxABTest | 63.04 | 2.4 | 23.88 |
| RevenueByHostHourly | 487.44 | 95.03 | 5.13 |
| SlaUnitAvailableFillRate | 1199.93 | 152.38 | 7.87 |
| SupplyDataTrends | 529.92 | 45.28 | 11.7 |
CPU-to-GPU migration goals
We began with a single server (as described earlier) capable of scaling to a multi-GPU and multi-server cluster. The cluster would be managed by Kubernetes, as opposed to the current Mesos cluster. Mesos was going to become obsolete and NVIDIA environments support Kubernetes.
Any changes in the software and hardware environment would have to be oblivious to Taboola’s code. Queries run on GPUs should execute with the exact results as CPUs. The team was aware of this challenge, as production stability was a critical goal.
Lastly, we wanted the GPU to outperform the CPUs by a minimum factor of 3. We benchmarked several GPUs including NVIDIA P100, NVIDIA V100, NVIDIA A100, and NVIDIA A30. We learned that the A30 GPU gave us the best price-performance fit.
First experiment with RAPIDS Accelerator
We ran SQL queries using RAPIDS Accelerator with somewhat disappointing results. Some of the less complex queries, mostly with lateral view explode, gave a 3x to 5x factor over the CPU. Some showed much lower factors, while other queries crashed.
After asking questions in the RAPIDS GitHub repo, we tried relevant Apache Spark and RAPIDS Accelerator parameters and began seeing better results:
sql.files.maxPartitionBytes: The CPU uses a default value of 128 MB. This is too low for the GPU. We are using 1–2 GB.sql.shuffle.partitions: We found the 200 default to be sufficient in most cases.rapids.sql.concurrentGpuTasks: Determines the number of tasks that can be run concurrently on the GPU. A minimum of at least two tasks appears to be best.
Tuning these parameters helped the queries run more smoothly and perform better in some cases. The NVIDIA Accelerated Spark Analysis tool can automatically generate tuning recommendations.
Challenge #1 – Parquet parsing overhead
We experienced bottlenecks on some of the less performant SQL queries, with most of them wasting time parsing Parquet footer data on the CPU. The Parquet data has more than 1500 columns. It was apparent that regular Java code for parsing the footer was not adequate for such a large footer.
Figure 2 shows a small section of NVIDIA profiler output for a 9-second Apache Spark task where the GPU was mostly idle (only working for 330 ms).
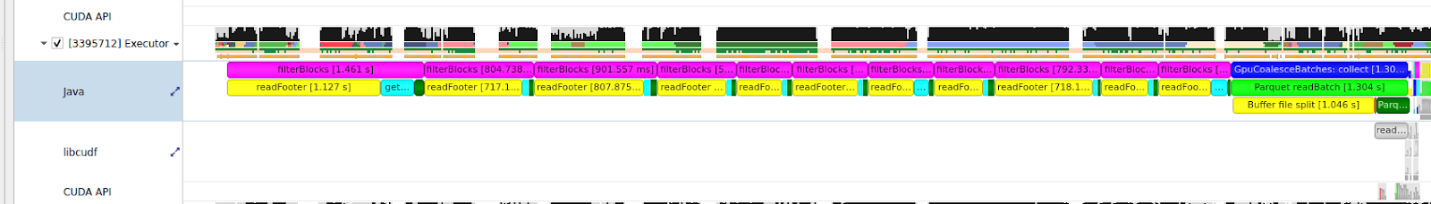
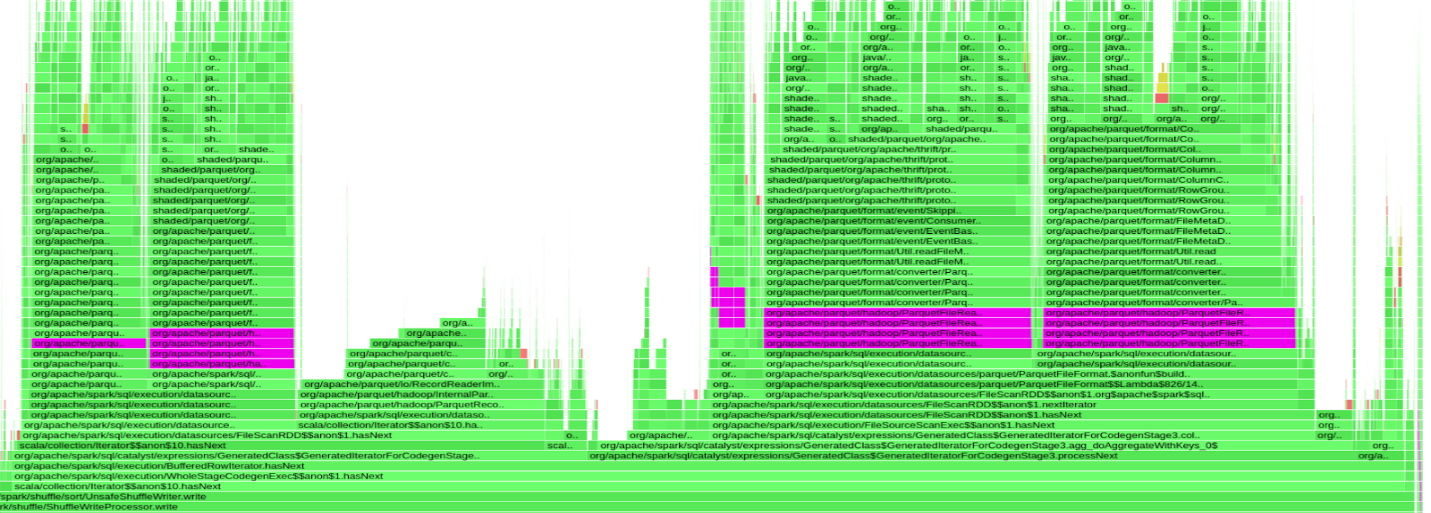
Figure 3 shows a flame graph of a query suffering from this behavior. The purple bars indicate time spent inside the org.apache.parquet.hadoop.ParquetFileReader class. Almost 50% of the query time was spent on parsing Parquet’s footer while the GPU was idle.
As such, we set off to test an alternative solution. When parsing the footer, Parquet code would iterate over footer metadata serially for each row group. We adjusted Parquet parameters to decrease the number of row groups in each file. This gave us about 10–15% improvement. We found this improvement to be insufficient.
Each time metadata was read, all 1500 columns of metadata were read and parsed serially, even after only asking for 50-100 columns per query. We wanted to index footer metadata such that instead of reading the entire 1500 data columns serially, we’d just access it directly. We managed to make this happen by changing the Parquet-mr public code in C++ and Java. Although we got nice performance results, this was too cumbersome and complex.
Fortunately, the NVIDIA RAPIDS team had a much better idea. The solution was optimal Parquet file parsing. They replaced the Java code with Arrow’s C++ implementation. We now have the rapids.sql.format.parquet.reader.footer.type set to NATIVE by default for our GPU implementation. The bottleneck was solved and there were no longer queries with the GPU idle because of footer parsing overheads on the CPU.
Challenge #2 – Network bottleneck
A weak network card caused the next bottleneck. While the 10-Gb/s Ethernet card sustained the CPU load, it failed to do so for the GPU load.
The solution was an optimal network card for GPU loads. Replacing the 10-Gb/s Ethernet card with a 25-Gb/s card removed this bottleneck.
Challenge #3 – Disk I/O bottleneck
Even after removing the two bottlenecks, queries still ran slow. On the Apache Spark user interface, we saw a clear indication as to what was happening.
| Metric | Min | 25th percentile | Median | 75th percentile | Max |
| Duration | 0.4 s | 0.6 s | 0.8 s | 1 s | 1.2 min |
| GC Time | 0.0 ms | 0.0 ms | 0.0 ms | 90.0 ms | 0.5 s |
| Shuffle Read Size/Records | 21.4 MB/1000 | 22.3 MB/1000 | 22.5 MB/1000 | 22.7 MB/1000 | 27.3 MB/1000 |
| Shuffle Write Size/Records | 17.5 MB/1000 | 17.9 MB/1000 | 18 MB/1000 | 18.1 MB/1000 | 18.1 MB/1000 |
| Scheduler Delay | 3.0 ms | 5.0 ms | 5.0 ms | 7.0 ms | 3 s |
| Peak Execution Memory | 64 MB | 64 MB | 64 MB | 64 MB | 64 MB |
| Shuffle Write Time | 9.0 ms | 13.0 ms | 18.0 ms | 21.0 ms | 59 s |
In Table 2, in the Max column, the task’s duration is 1.2 minutes, while Shuffle Write Time took 58 seconds. A lot of time was wasted doing shuffle work while the GPU was idle.
Figures 4 and 5 show the appropriate event timeline graph. The orange part represents shuffle times, read or write. The green parts are compute time. We were wasting a lot of time reading or writing shuffle files.
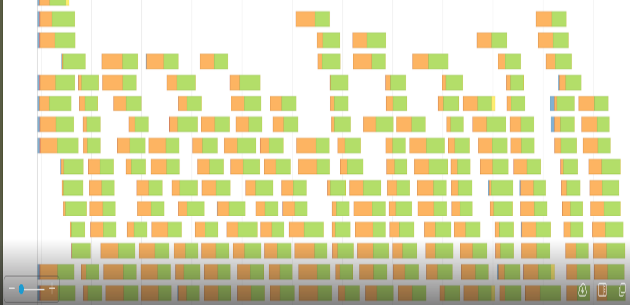
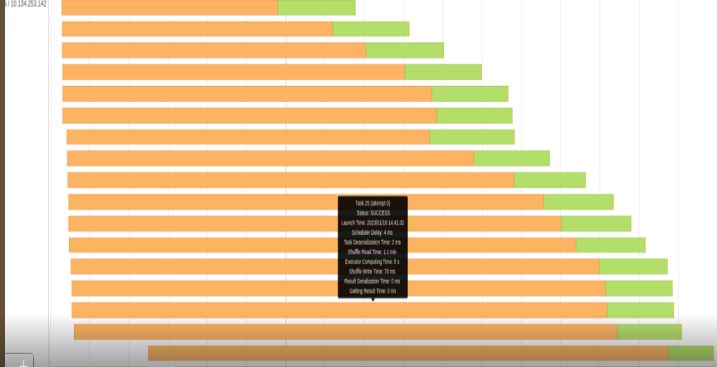
Our shuffle files can get up to 500 GB and greater in some queries. We obviously can’t keep this huge amount of data in the server’s RAM, so shuffle files are stored in the local SSD drive.
After a quick investigation with our teams, we figured out that the SSD drive was configured to use RAID-1. Each temporary shuffle file was saved twice to the disk. This wasted a lot of time and switching to RAID-0 somewhat improved the situation.
The GPU put more pressure on the SSD drive than the CPU such that we had to replace the SSD with an NVMe drive. The solution was to switch to a 6-TB NVMe drive. We removed one of the GPUs to create a slot for the NVMe drive. Afterward, we had no shuffle read or write performance issues. We also learned that one NVMe drive could sustain the workload of two A30 GPUs.
Moving to Kubernetes
Because our Mesos cluster would become obsolete, the move to Kubernetes from a standalone POC machine was imperative. This involved a lot of configuration work, and other minor work. Still, it was straightforward to implement.
The basic idea is that the Apache Spark driver would sit on a non-GPU machine and each K8s Pod would be associated with a single GPU. For more information, see Getting Started with RAPIDS and Kubernetes.
The following code example shows some of the major relevant Kubernetes configurations.
spring:
  profiles:
    include: spark_k8s_extra_files

    spark:
      driver:
        sparkConnector:
          sparkOpts:
            spark.kubernetes.container.image.pullPolicy: Always
            spark.kubernetes.authenticate.serviceAccountName: spark
            spark.kubernetes.executor.deleteOnTermination: true
            spark.deploy.mode: client
            spark.executorEnv.preLoadMemoryLibraryName: "/usr/libjemalloc.so"
            spark.executorEnv.xmxPercentage: 80
            spark.kubernetes.memoryOverheadFactor: 0.1
            spark.mesos.fetcherCache.enable: false
            spark.executor.extraJavaOptions:
              -XX:-UsePerfData
              -XX:-OmitStackTraceInFastThrow
              -verbose:gc
              -XX:+UseParallelGC
              -XX:+UseParallelOldGC
              -XX:+PrintFlagsFinal
              -Dmapreduce.fileoutputcommitter.algorithm.version=2
              -XX:NativeMemoryTracking=detail

            spark.plugins: "com.nvidia.spark.SQLPlugin"
            spark.kubernetes.executor.podTemplateFile: /conf/k8GPUPodTemplateProduction.yml
            spark.executor.resource.gpu.vendor: "nvidia.com"
            spark.executor.resource.gpu.discoveryScript: /conf/getGpusResources.sh
            spark.executor.resource.gpu.amount: 1

            # GPU task configuration
            spark.rapids.sql.variableFloatAgg.enabled: "true"
            spark.rapids.sql.castFloatToDecimal.enabled: "true"
            spark.rapids.sql.rowBasedUDF.enabled: "true"
            spark.rapids.sql.format.parquet.reader.footer.type: "NATIVE"
            spark.rapids.sql.explain: "all"   # For debug.

            # Most common
            spark.rapids.sql.concurrentGpuTasks: 4
            spark.sql.files.maxPartitionBytes: "2048m"
            spark.rapids.sql.batchSizeBytes: "1g"
            spark.sql.shuffle.partitions: 200
How many GPUs to accelerate?
If the goal is to use GPUs to accelerate workloads more cost-effectively than CPUs, we first had to understand how fast GPUs were. We set up a test system with two A30 GPUs and streamed production data to it in parallel with our large CPU core production environment.
Figure 6 shows two of our heaviest queries running on the production CPU cluster and also on the server with two A30 GPUs.
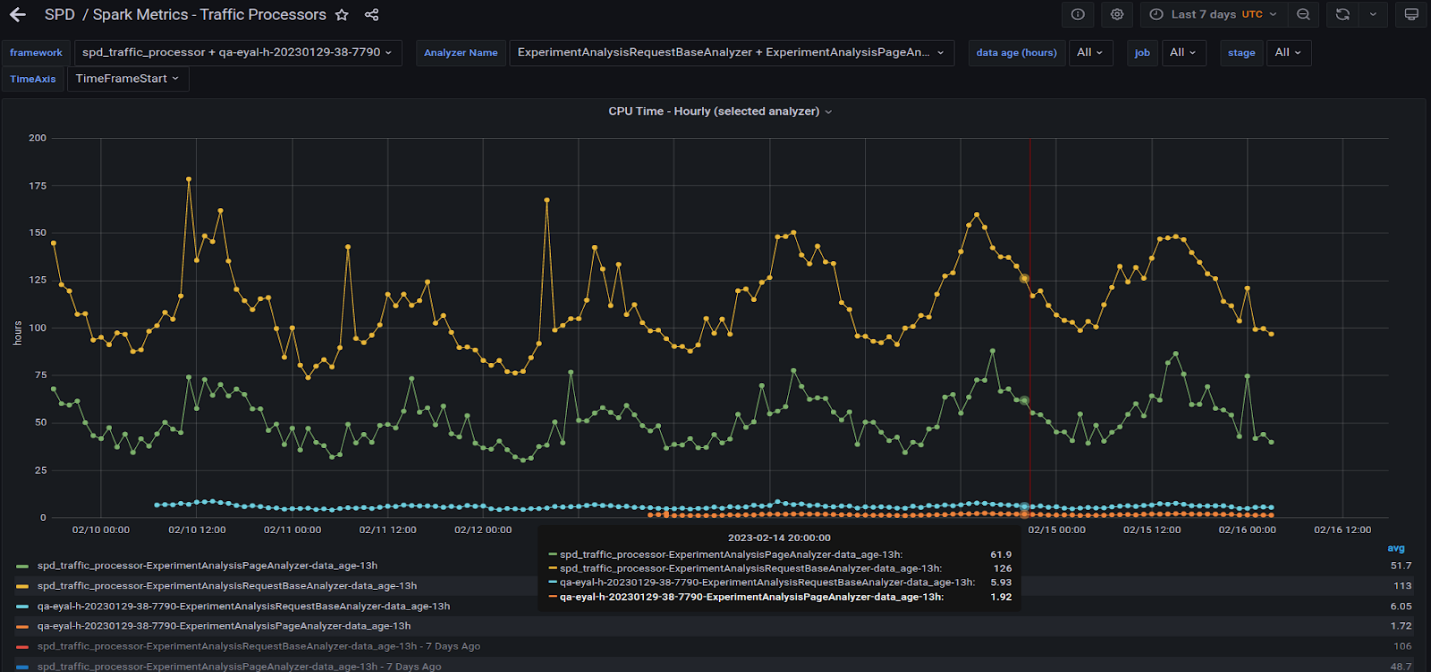
The yellow and green lines denote the hourly total time across all task numbers of the two queries running on the CPU cluster. The blue and orange lines denote the same queries running on the GPU server. GPU factors are 20x and higher.
Figure 7 shows the two queries running on the GPU shown in Figure 6. Observe that they behave similarly to the CPU in that peaks and valleys roughly align at different times of the day.
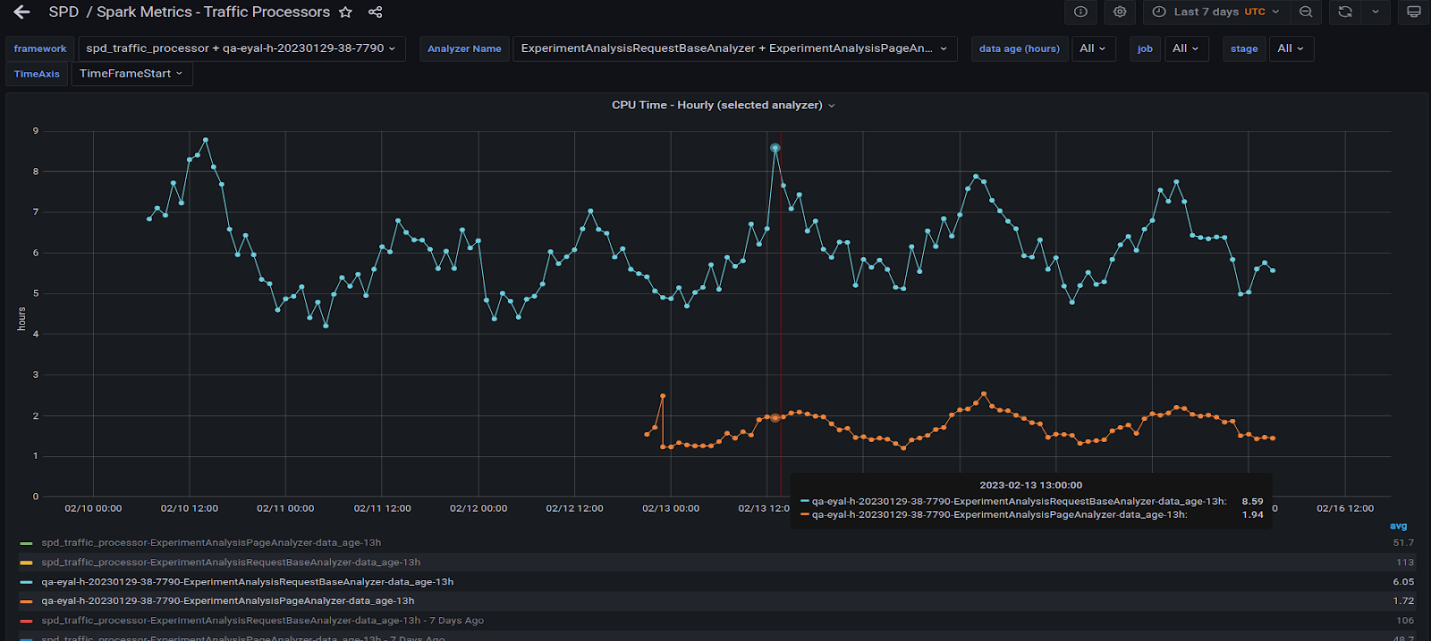
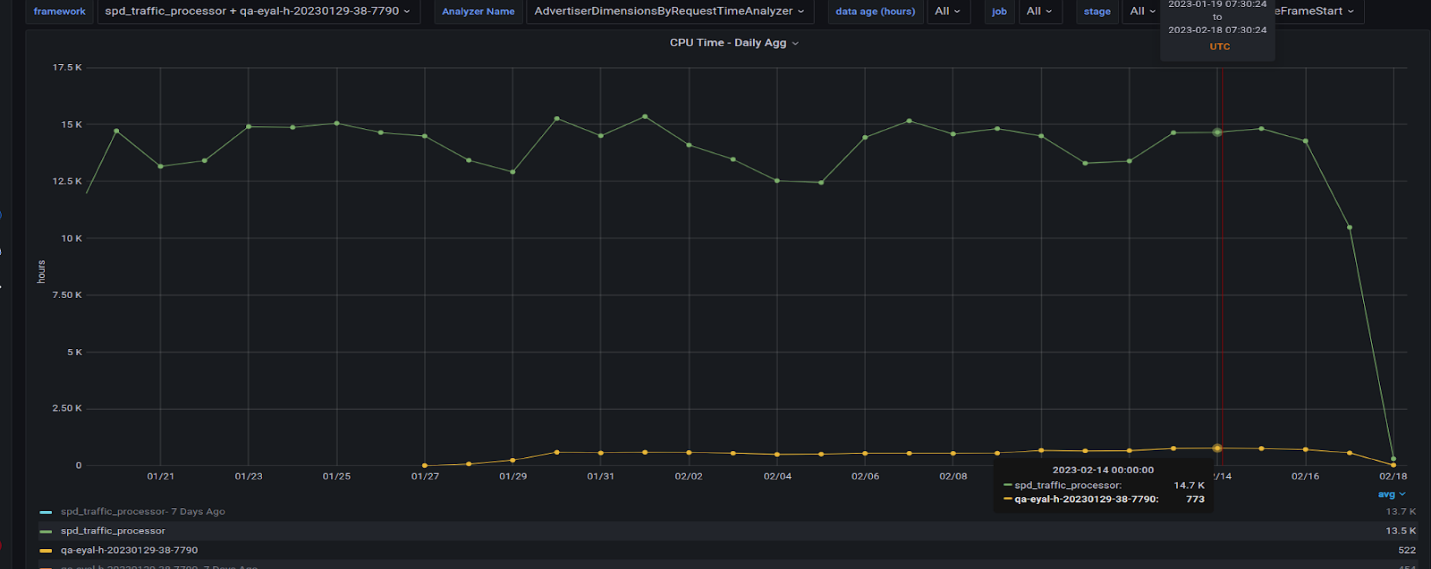
Figure 8 is interesting in that it shows the factor of all the queries that we migrated to the GPU and their counterparts on the CPU. The GPU run is missing the biggest query, which we are still working on migrating to the GPU. It will likely add 200 hours per day to the GPU total time.
Lessons learned
Looking ahead to our next migration steps, Taboola would like to move queries from other R&D departments to the GPU, resulting in a greater number of GPUs in production. This means that QA must monitor the system more closely while in production.
Getting acquainted with RAPIDS Accelerator for Apache Spark was an amazing “joy ride” effort. From handling Parquet files to pushing GPUs to their limit, we became better equipped at handling a large data pipeline along with managing data center capacity and hardware costs. Identifying and coping with hardware limitations with this method proved to be rewarding.
Here are Taboola’s top takeaways for those considering CPU-to-GPU migration:
- Tuning parameters in complex environments that have multiple variables is never straightforward. Automate this task to whatever degree possible. It’s probably a good idea to use the NVIDIA Accelerated Spark Analysis tool to help address this challenge, as it can easily suggest optimized parameters.
- Look beyond CPUs and GPUs for solutions to bottlenecks. No amount of GPU horsepower can resolve issues that are fundamentally network, disk, bandwidth, or configuration and parsing related.
- Multiple GPUs do not hinder performance, but GPUs are so powerful that you may have good performance with fewer GPUs than originally thought. It’s best to test for this to lower costs.
- We achieved our 20x factor through RAPIDS Accelerator and NVIDIA GPUs. The biggest lesson learned was that we needed to better understand what was happening in our existing environment before benefiting from GPU acceleration. One A30 GPU sustained the same production load for some workloads as the ~200-CPU core test cluster.
For more information about achieving performance multiples over Apache Spark CPU-based environments, see GPU-Accelerated Apache Spark.
Acknowledgments
Our huge effort was more successful with the support, assistance, and patience of two great groups of people. At Taboola: Andrey Gourine, Gilad Zamoscinski, Igor Berman, Keren Corsia, Lior Chaga, and Michael Taranov. On the NVIDIA RAPIDS team: Alessandro Bellina, Hao Zhu, Karthikeyan Rajendran, Robert Evans, and Sameer Raheja.