From active noise cancellation to digital assistants that are always listening for your commands, audio is perhaps one of the most important but often overlooked aspects of modern technology in our daily lives. Audio Analytic has been using machine learning that enables a vast array of devices to make sense of the world of sound. Read article >
Im kinda new to the ML community and i’ve been trying to make a custom data generator for both python and R. I’ve managed to make the python one based on this fantastic ressource but i’m struggling with calling it from a R script… I’ve tried with the reticulate library but i can’t seem to make it all work well together. Does anyone know how to do it or can point me toward a good ressource/ code example?
I want to use TensorFlow to make a program that can detect digits from an image. These are printed digits, not handwritten digits. I’ve attached an example photo of what I’m referring to.
What would be the best way to start on something like this? I saw there was an official tutorial for handwritten digits but I didn’t know if it applied to printed digits. What kind of algorithm should I use and what would be the best way to train a classifier?
As you can see it outputs an overall combined loss and separate losses for different outputs. But there is no combined accuracy score. What I want is a combined accuracy score ( Which will consider a sample is correct if all the output labels are correct). How can I calculate overall combined accuracy for my multioutput model?
Dive into the Omniverse Code app—an integrated development environment for users to easily build their own Omniverse extensions, apps, or microservices.
It’s now even easier for developers to build advanced tools for 3D design and simulation with Omniverse Code, a new NVIDIA Omniverse app that serves as an integrated development environment (IDE) for developers and power users.
Using Omniverse Code, now in beta, developers can quickly become familiar with the platform while building their Omniverse extensions, apps, or microservices. Omniverse Code includes Omniverse Kit SDK runtime, and provides the foundational tools, templates, and documentation. In a simple-to-navigate interface, developers can easily experience the powerful capabilities of Omniverse Kit SDK when working on their own Omniverse-based projects.
Get started with Extension Manager
When using Omniverse Code, there’s no need to build from scratch. Developers have access to hundreds of Omniverse Extensions to edit, modify, or integrate into their own extensions or applications.
The platform is extremely modular, easily extensible, and flexible. Users can tease apart extensions, use them as templates, or build feature sets on top of the existing extensions.
Extension Manager is one of the most valuable resources, housing over 200 NVIDIA-developed extensions, all part of the Omniverse Kit SDK.
Figure 1. Premade templates within the Code app helps you speed up development.
Learn more about using Extension Manager in Omniverse Code.
Experience interactive documentation
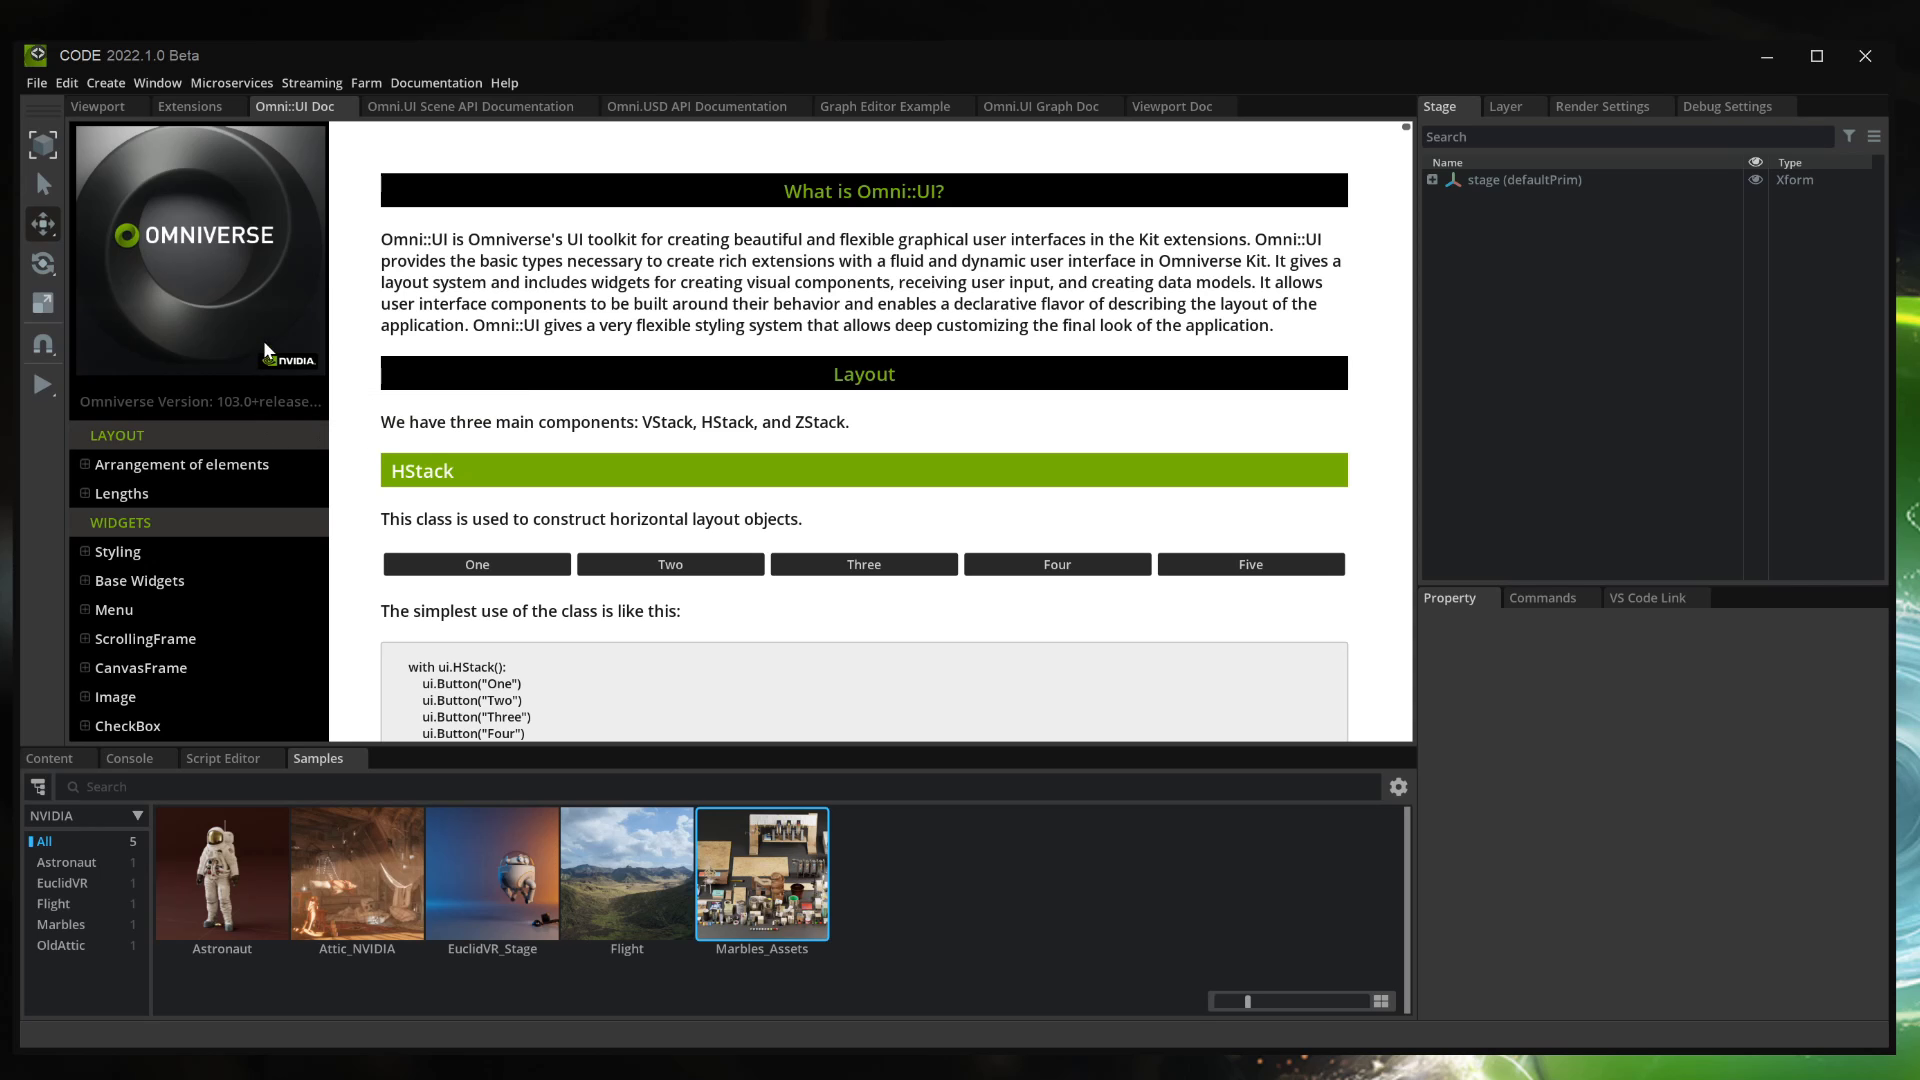
Developers can leverage the fully interactive Omni.ui documentation. The new feature is integrated directly into the user interface of Omniverse Code, with fully functioning buttons, sliders, and other features within the documentation.
It also exposes documentation code directly so users can copy and paste it as a whole, or modify it as needed. With Omniverse Code, interactive integration is extended across other areas of the platform, so developers can get started faster than ever.
Figure 2. With interactive documentation you can take premade templates from the Code app rather than building from scratch.
One of the new frameworks for this release of Omniverse Kit is Omni.ui.scene—a new manipulator and scene overlay system—enables users to construct interactive manipulators and control objects within a 3D environment. Developers can get started with a provided collection of standard manipulators or build their own by writing very little Python code.
Discover the new 3D viewport
With the release of Omniverse Kit 103 and Omniverse Code, a new, fully customizable viewport menu serves as a one-click portal into various tools available to developers.
The viewport manipulator is available and programmable in Python, so users can inspect, tweak, modify, or rebuild their own. Developers can also configure multiple viewports individually with unique cameras and renderers, unlocking the ability to preconfigure different vantages instantaneously.
Get more information about these features in this short introductory video.
Get the latest Omniverse news
Join the Omniverse Developer Day at GTC to learn more about the new Code app, and interact directly with the development team.
Watch the GTC keynote, presented by NVIDIA CEO Jensen Huang, on March 22 at 8 am PT, to see the latest technologies driving the future of AI and graphics.
Learn more about Omniverse Code in the upcoming Twitch stream on Wednesday, Feb. 2 at 11 am PT / 8 pm CET.
I have a neural network that was trained on a x64 system with a 3080. I am trying to run it on a jetson nano based on ARM64 architecture.
The neural network runs on the original machine that it was trained on, but trying to get it on the jetson nano gives bad marshal code, which I assume is a problem with the architecture
Support for the new GeForce RTX 3080 Ti and 3070 Ti Laptop GPUs is available today in the February Studio driver. Updated monthly, NVIDIA Studio drivers support NVIDIA tools and optimize the most popular creative apps, delivering added performance, reliability and speed to creative workflows. Creatives will also benefit from the February Studio driver with Read article >
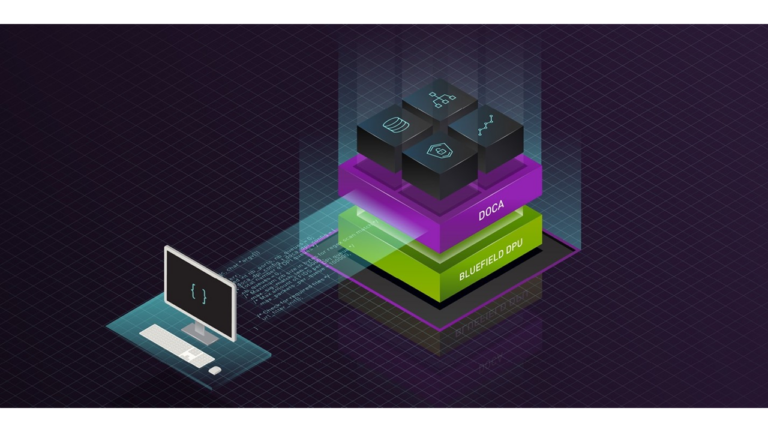
The development process for DPUs can get complex. This is where NVIDIA DOCA comes in. With several built-in libraries that allows for plug-n-play and simple application development.
In this post, I take you through the creation of the FRR DOCA dataplane plugin and show you how to offload PBR rules using the new DOCA flow library. In the previous post, you saw the creation of a FRR dataplane plugin to accelerate PBR rules on BlueField using the DPDK rte_flow library. For part 1, see Developing Applications with NVIDIA BlueField DPU and DPDK.
Adding the DOCA dataplane plugin to Zebra
I still used the DPDK APIs for hardware initialization, but then used the DOCA flow APIs for setting up the dataplane flow pipeline. To do that I had to link the DPDK (libdpdk.pc) and DOCA flow (doca-flow.pc) shared libraries to the DOCA dataplane plugin.
I added the pkg check-and-define macro for DPDK and DOCA flow in the FRR makefile (configure.ac).
if test "$enable_dp_doca" = "yes"; then
  PKG_CHECK_MODULES([DOCA], [libdpdk doca-flow], [
    AC_DEFINE([HAVE_DOCA], [1], [Enable DOCA backend])
    DOCA=true
  ], [
    AC_MSG_ERROR([configuration specifies --enable-dp-doca but DOCA libs were not found])
  ])
fi
I included both the DPDK and DOCA flow libs and cflags into the zebra-dp-doca make macro (zebra/subdir.am).
The DOCA dataplane plugin can be enabled when the FRR service is started using /etc/frr/daemons.
zebra_options= " -M dplane_doca -A 127.0.0.1"
Hardware initialization and port mapping
Using the DPDK APIs, rte_eal_init and rte_eth_dev_info_get, for initializing the hardware and for setting up the Zebra interface to DPDK port mapping. This workflow is the same as with the DPDK dataplane plugin in the previous section.
To use doca-flow for programming PBR rules, I had to initialize the doca-flow and doca-flow-port databases. This initialization was done after the hardware was initialized using rte_eal_init.
I used doca_flow_init for initializing the doca-flow library with the flow and queue count config.
I skipped populating fields such as eth or eth-mask. This is because the doca-flow library can auto-populate such fields to RTE_ETHER_TYPE_IPV4 or RTE_ETHER_TYPE_IPV6, based on other match fields, dst_ip or src_ip.
Flow actions
To route the packet, I had to change the destination MAC address to the gateway (leaf2) MAC, decrement the TTL, and change the source MAC address. This was originally discussed in part 1, Developing Applications with NVIDIA BlueField DPU and DPDK.
The first step creates a software template for a lookup stage. The second step uses the template to program the flow in the hardware.
Pipes are useful when you must program many similar flows. For such a case, you can set up a single match template (pipe) and indicate which match-field must be updated at the time of flow entry creation (for example, a layer 4 destination port). Subsequent flow entries need onlypopulate the match fields that vary from the pipe (the layer 4 destination port).
In the case of PBR, each flow pattern is unique, so I created a separate pipe and entry for each PBR rule using the flow attributes that I already populated.
// hit counters – query.total_pkts and query.total_bytes memset(&query, 0, sizeof(query)); doca_flow_query(flow_entry, &query);
Verifying hardware acceleration
The FRR-PBR rule configuration and traffic generation is the same as with dpdk-plugin. The traffic is forwarded by the DPU hardware as expected and can be verified using the flow counters.
root@dpu-arm:~# vtysh -c "show dplane doca pbr flow" Rules if pf0vf0 Seq 1 pri 300 SRC IP Match: 172.20.0.8/32 DST IP Match: 172.30.0.8/32 IP protocol Match: 17 DST Port Match: 53 Tableid: 10000 Action: nh: 192.168.20.250 intf: p0 Action: mac: 00:00:5e:00:01:fa DOCA flow: installed 0xffff28005150 DOCA stats: packets 202 bytes 24644root@dpu-arm:~#
FRR now has a second dataplane plugin for hardware acceleration of PBR rules, using doca-flow.
Application development takeaways
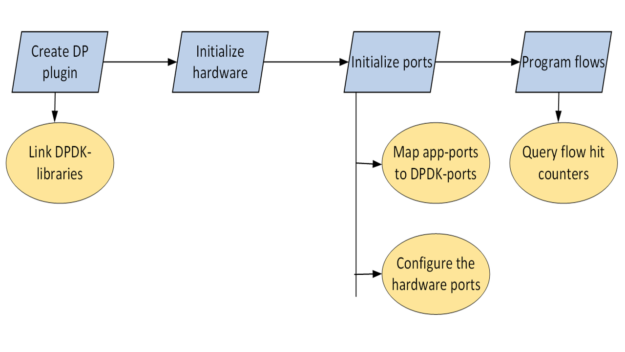
In this series, you saw how a DPU networking application can be hardware-accelerated with four steps using rte_flow or doca_flow:
Link the DOCA/DPDK libraries to the application.
Initialize the hardware.
Setup the application to hardware port mapping.
Program flows for steering the traffic.
As more elements are offloaded on the DPU, the development process can get complex with increasing source lines of code (SLOC). That’s where DOCA abstractions help:
DOCA comes with several built-in libraries such as doca-dpi, gRPC, Firefly time synchronization, and more. These libraries enable quick plug-n-play for your application.
DOCA constructs such as doca_pipe enable you to templatize your pipeline, eliminating boilerplate code and optimizing flow insertion.
Upcoming DOCA libraries, such as the hardware-accelerated LPM (Longest prefix match) make building switch pipelines easier. This is particularly relevant to the sample application that you saw in this series, FRR, which is commonly deployed for building a LPM routing table (or RIB) with BGP.
With DOCA, you can also leapfrog into the exciting world of GPU + DPU development on the converged accelerators.
Figure 1. Converged Accelerator
Are you ready to take your application development to dizzying heights? Sign up for the DOCA Early Access developer program to start building today.
For more information, see the following resources:
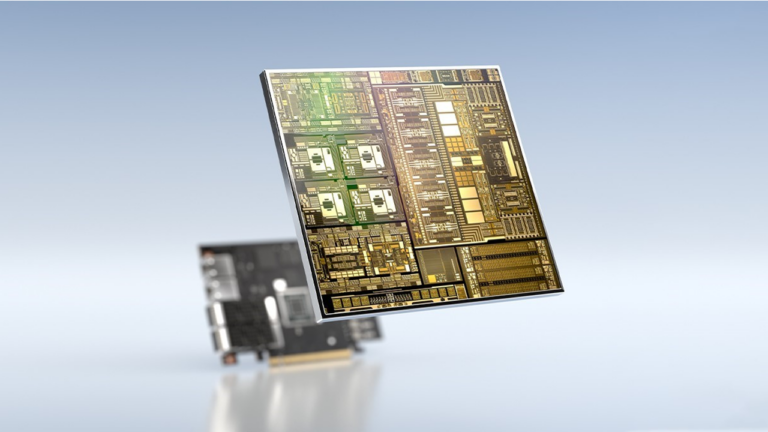
Developing and application and offloading it in two ways, via DPDK and via DOCA libraries, to run on the BlueField Data Processing Unit
The NVIDIA BlueField DPU (data processing unit) can be used for network function acceleration. This network offloading is possible using DPDK and the NVIDIA DOCA software framework.
In this series, I built an app and offloaded it two ways, through the use of DPDK and the NVIDIA DOCA SDK libraries. I recorded each step as a separate code patch and provided the complete steps in each series. This shows you what it takes to program the BlueField DPU and the choice for the most elegant option for your unique use case. For part 2, see Developing Applications with NVIDIA BlueField DPU and NVIDIA DOCA Libraries.
Use case
First, I needed a simple yet meaningful use case for deploying an application on the DPU. I chose policy-based routing (PBR) to steer traffic to different gateways based on Layer 3 and Layer 4 packet attributes, overriding (or supplementing) the gateway chosen by the X86-host. This can be done for a variety of reasons in the real world, including the following examples:
Sending select host traffic to an external firewall for additional auditing
Enhanced load balancing to anycast servers
Applying QoS
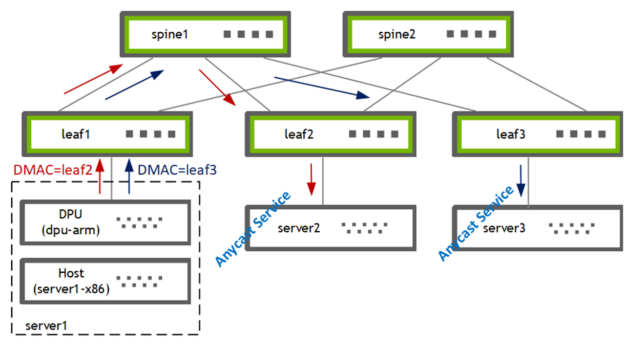
Figure 1. Traffic is steered from the host to one of the two gateways using PBR
I used PBR on the DPU (bf2-arm) to steer traffic from the host (server1-x86) to one of the two gateways [leaf2, leaf3]. The leaf switch subsequently forwards the traffic to its locally attached anycast service provider [server2, server3].
Building the application
First question: do I write a brand-new app or do I offload an existing one?
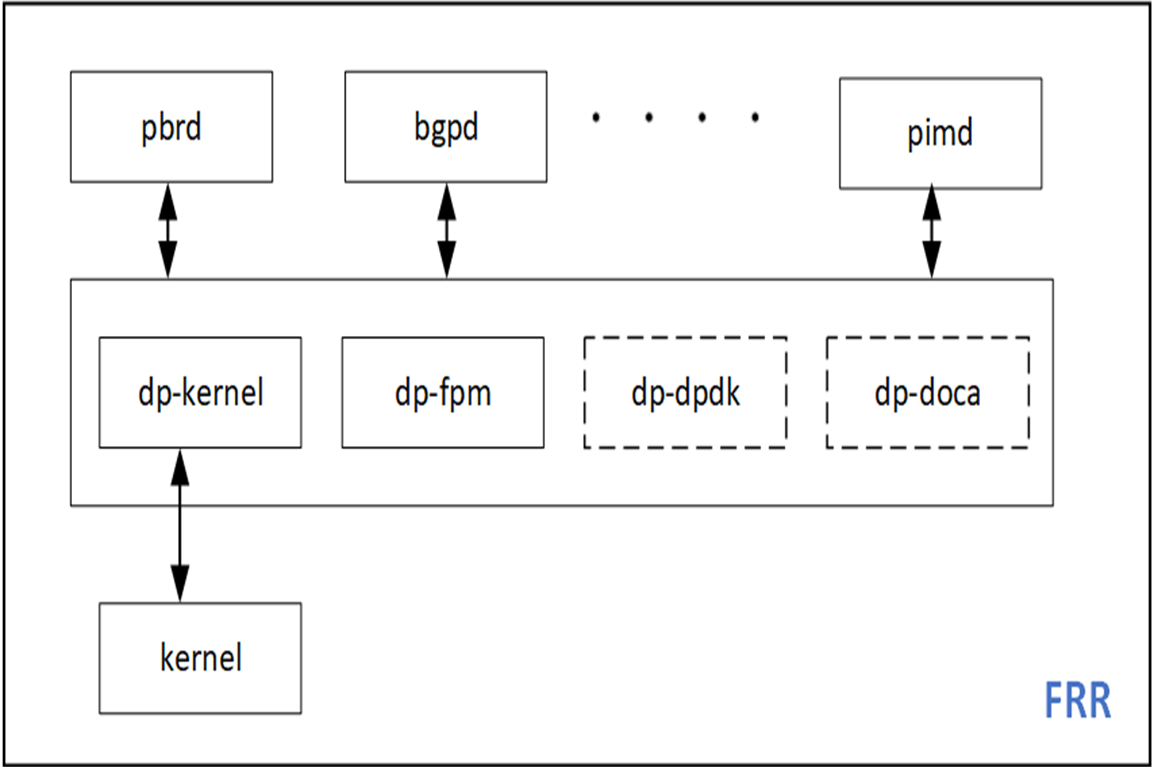
I decided to offload the PBR functionality of my favorite open-source routing stack, FRRouting (FRR). This allows me to extend an existing codebase and provides a nice contrast to the existing sample apps. FRR has an infrastructure for multiple dataplane plugins so DPDK and DOCA can be easily added as new FRR plugins.
Figure 2. DPDK and DOCA plugins can easily be added to FRRouting
DPU application prototyping
In this section, I walk through the prep work needed for creating an app with DPU hardware acceleration.
DPU hardware
I have a BlueField-2 DPU hosted by an x86 server. This DPU has two 25G uplinks and an Arm CPU with 8G RAM. For more information about hardware installation, see the DOCA SDK docs. You can alternately bootstrap your setup using the DPU PocKit.
I installed the BlueField boot file (BFB), which provides the Ubuntu OS image for the DPU and comes with the libraries for DOCA-1.2 and DPDK-20.11.3.
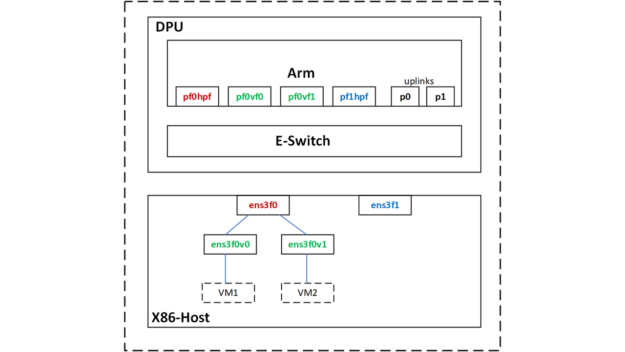
Figure 3. Netdev representors
Using SR-IOV, I created two virtual function (VF) interfaces on the host for two VMs.
Testpmd is memory hungry and allocates a cool 3.5G by default. As I didn’t need to process data traffic in the CPU, I allocated a total-mem value of 200M, where total-mem = total-num-mbufs * mbuf-size (the default mbuf-size is 2048 bytes). I also used flow-isolation because I had to send ARP packets up to the kernel networking stack on the DPU, for PBR next-hop resolution). The -i option drops you into the testpmd interactive shell after the initialization is complete.
As a part of the rte_eal initialization done by testpmd, the mlx5_pci devices are probed and the DPDK ports populated.
testpmd> show port summary all
Number of available ports: 6
Port MAC Address Name Driver Status Link
0 04:3F:72:BF:AE:38 0000:03:00.0 mlx5_pci up 25 Gbps
1 4A:6B:00:53:79:E5 0000:03:00.0_representor_vf4294967295 mlx5_pci up 25 Gbps
2 62:A1:93:8D:68:C4 0000:03:00.0_representor_vf0 mlx5_pci up 25 Gbps
3 0A:8E:97:F5:C0:41 0000:03:00.0_representor_vf1 mlx5_pci up 25 Gbps
4 04:3F:72:BF:AE:39 0000:03:00.1 mlx5_pci up 25 Gbps
5 D2:0B:15:45:94:E8 0000:03:00.1_representor_vf4294967295 mlx5_pci up 25 Gbps
testpmd>
The DPDK ports that you see here correspond to the PF/VF representors and the two uplinks.
DPDK port
DPU netdev
Comments
0
p0
25G uplink attached to leaf1
1
pf0hpf
2
pf0vf0
VM1
3
pf0vf1
VM2
4
p1
5
pf1hpf
Table 2. DPDK port mapping
Flow creation
Next, I set up the PBR rule as a rte_flow by defining the ingress port, source IP, destination IP, protocol, and port. Along with that, I defined the action to take on matching packets. The source and destination MACs are rewritten, the TTL is decremented, and the egress port is set to the physical uplink, p0.
This PBR rule receives UDP and DNS traffic from VM1 and sends it to a specific GW (leaf2, server2). I also attached a counter-action to the flow for easy troubleshooting.
testpmd> flow create 2 ingress transfer pattern eth / ipv4 src is 172.20.0.8 dst is 172.30.0.8 proto is 17 / udp dst is 53 / end actions dec_ttl / set_mac_src mac_addr 00:00:00:00:00:11 / set_mac_dst mac_addr 00:00:5e:00:01:fa / port_id id 0 / count / end
Flow rule #0 created
testpmd>
The DPU can operate in the DPU-switch or DPU-NIC modes. In this use case, I had to redirect traffic from the X86-host to the 25G-uplink, after a few packet modifications. So, I conceptually used it in the switch or FDB mode. There is no additional configuration to setting up this mode beyond using the right rte_flow attribute, which in this case is transfer.
Flow verification
I sent some traffic from VM1 to see if it matched the flow that I created with the testpmd flow query command.
The flow is matched, and traffic is seen on leaf2/server2 with the modified packet headers. The traffic that is being steered is DNS, so to test the flow, I sent DNS requests from VM1. To have some control over the traffic rate and other packet fields, I used mz for test traffic generation.
ip netns exec vm1 mz ens3f0v0 -a 00:de:ad:be:ef:01 -b 00:de:ad:be:ef:02 -A 172.20.0.8 -B 172.30.0.8 -t udp "sp=25018, dp=53" -p 80 -c 0 -d 1s
An additional sanity check is to see if this flow is really offloaded. There are two ways to do that:
Use tcpdump on the Arm CPU to ensure that this packet flow is NOT received by the kernel.
Check if the hardware eSwitch is programmed with the flow.
mlx_steering_dump allows you to look at the hardware programmed flows. Download and install the tool using git.
This command dumps all the flows programmed by the testpmd app. And we can see the outer IP header matches that we setup – [SIP=172.20.0.8, DIP=172.30.0.8, IP-proto=UDP, UDP-dport=53]. The flow counters are read and cleared as a part of the dump.
Prototyping, the final step of the app design-thinking process is now complete. I now know I can build a PBR rule in DPDK, that is installed in hardware and is taking action on our packets. Now to add the DPDK dataplane in the next section.
Building the DPDK dataplane plugin
In this section, I walk through the steps for PBR hardware acceleration on the DPU by adding a DPDK dataplane plugin to Zebra. I broke these steps into individual code-commits and the entire patch-set is available as a reference.
As the target architecture is DPU-Arm, you can build directly on an Arm CPU, cross-compile on a X86 CPU, or build in the cloud. For this post, I coded and built directly on the DPU Arm CPU.
Run app as root user
FRR is typically run as a non-root user. FRR can download and upload the entire internet routing table; what could possibly go wrong with that? However, almost all the DPDK apps are run as root users and the DPDK libraries and drivers have come to expect that.
After much experimentation, I couldn’t make FRR work as a non-root user and re-compiled it with the root-user options. This is acceptable as I was running FRR in a secure space, the DPU-Arm CPU.
Adding a new plugin to Zebra
Zebra is a daemon in FRR that is responsible for consolidating the updates from routing protocol daemons and building the forwarding tables. Zebra also has an infrastructure for pushing those forwarding tables into dataplanes like the Linux kernel.
Link DPDK shared libraries to zebra
FRR has its own build system which limits direct import of external make files. Thanks to the simple elegance of pkg-config, linking the relevant libraries to Zebra was easy.
I located libdpdk.pc and added that to the PKG_CONFIG_PATH value:
I added the pkg check-and-define macro for DPDK in the FRR makefile (configure.ac).
if test "$enable_dp_dpdk" = "yes"; then
PKG_CHECK_MODULES([DPDK], [libdpdk], [
 AC_DEFINE([HAVE_DPDK], [1], [Enable DPDK backend])
DPDK=true
 ], [
AC_MSG_ERROR([configuration specifies --enable-dp-dpdk but DPDK libs were not found])
 ])
fi
I included the DPDK libs and cflags abstractions into the zebra-dp-dpdk make macro (zebra/subdir.am).
This probes the PCIe devices and populates the DPDK rte_eth_dev database.
Initialize ports
Next, I set up the hardware ports.
Set up port mapping for the app
FRR has its own interface (port) table based on the Linux netdevs table, which is populated using NetLink updates and keyed in using ifIndex. PBR rules are anchored to an interface in this table. To program PBR dataplane entries, you need a mapping table between the Linux ifIndex and DPDK port-id values. The netdev information is already available in the DPDK driver and can be queried through rte_eth_dev_info_get.
struct rte_eth_dev_info *dev_info

RTE_ETH_FOREACH_DEV(port_id) {
 /* dev_info->if_index is used for setting up the dpdk port_idif_index mapping table
 * in zebra */
 rte_eth_dev_info_get(port_id, dev_info);
}
Configure hardware ports
In addition, all the ports need to be placed in flow isolation mode and started.
rte_flow_isolate(port_id, 1, &error);
Flow isolation sends flow-miss packets to the kernel networking stack, allowing it to handle things like ARP requests.
rte_eth_dev_start(port_id);
Program PBR rules using rte_flow APIs
PBR rules now need to be programmed as rte_flow lists. Here is a sample rule:
Filling these data structures requires a fair amount of mostly repetitive code.
Flow actions
DPDK uses a separate data structure for each action and then allows you to provide all the actions as a variable length array at the time of flow creation. The relevant actions are as follows:
Flow validation is typically used to check if the underlying DPDK driver can support the specific flow configuration. Flow validation is an optional step and in the final code, you can jump directly to flow creation.
Rte_flow commands are anchored to the incoming port. It is possible to create groups of flow entries and chain them. Even if a flow entry is not the first in the chain, not in group-0, it must still be anchored to the incoming port. That group-0 has performance limitations.
Flow insertion rate is limited in group-0. To bypass that limitation, you can install a default flow in group-0 to “jump to group-1” and then program the app’s steering flows in group-1.
Flow deletion
The flow creation API returns a flow pointer that must be cached for subsequent flow deletion.
rc = rte_flow_destroy(port_id, flow_ptr, &error);
The FRR-PBR daemon manages the state machine for resolving and adding or deleting PBR flows. So, I didn’t have to age them out using DPDK-native functions.
Flow statistics
At the time of flow creation, I attached a count-action to the flow. That can be used for querying the flow statistics and hits.
Next, I configured the PBR rule to match DNS traffic from VM1 and redirect it to leaf2, using frr.conf.
!
interface pf0vf0
pbr-policy test
!
pbr-map test seq 1
match src-ip 172.20.0.8/32
match dst-ip 172.30.0.8/32
match dst-port 53
match ip-protocol udp
set nexthop 192.168.20.250
!
I sent DNS queries from VM1 to the anycast DNS server.
root@dpu-arm:~# vtysh -c "show dplane dpdk pbr flows"
Rules if pf0vf0
 Seq 1 pri 300
 SRC IP Match 172.20.0.8/32
 DST IP Match 172.30.0.8/32
 DST Port Match 53
 Tableid: 10000
 Action: nh: 192.168.20.250 intf: p0
 Action: mac: 00:00:5e:00:01:fa
 DPDK: installed 0x40
DPDK stats: packets 14 bytes 1708
root@dpu-arm:~#
Flow is matched and traffic is forwarded to the destination, leaf2/server2, with the modified packet headers. This can be verified with the counters attached to the flow and through the hardware dumps using mlx_steering_dump.



 Dive into the Omniverse Code app—an integrated development environment for users to easily build their own Omniverse extensions, apps, or microservices.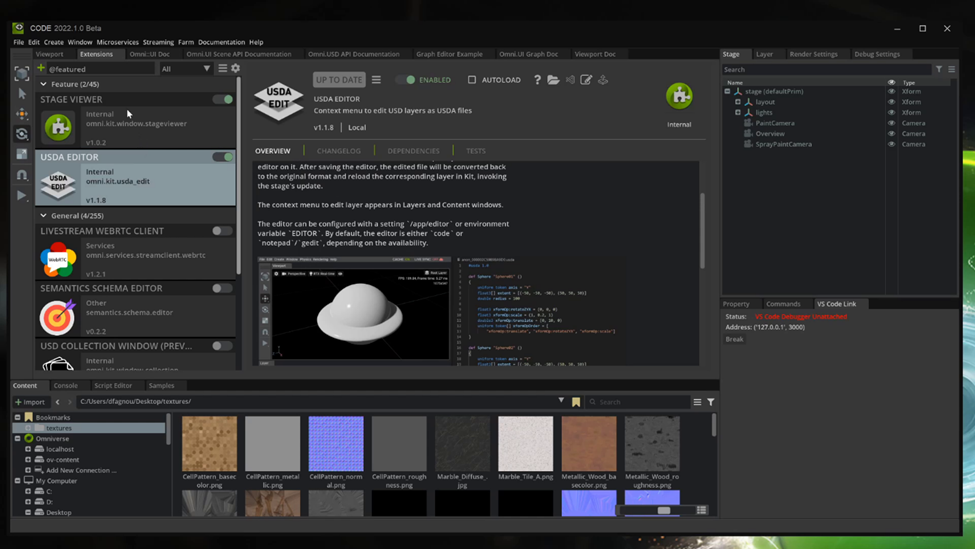
 The development process for DPUs can get complex. This is where NVIDIA DOCA comes in. With several built-in libraries that allows for plug-n-play and simple application development.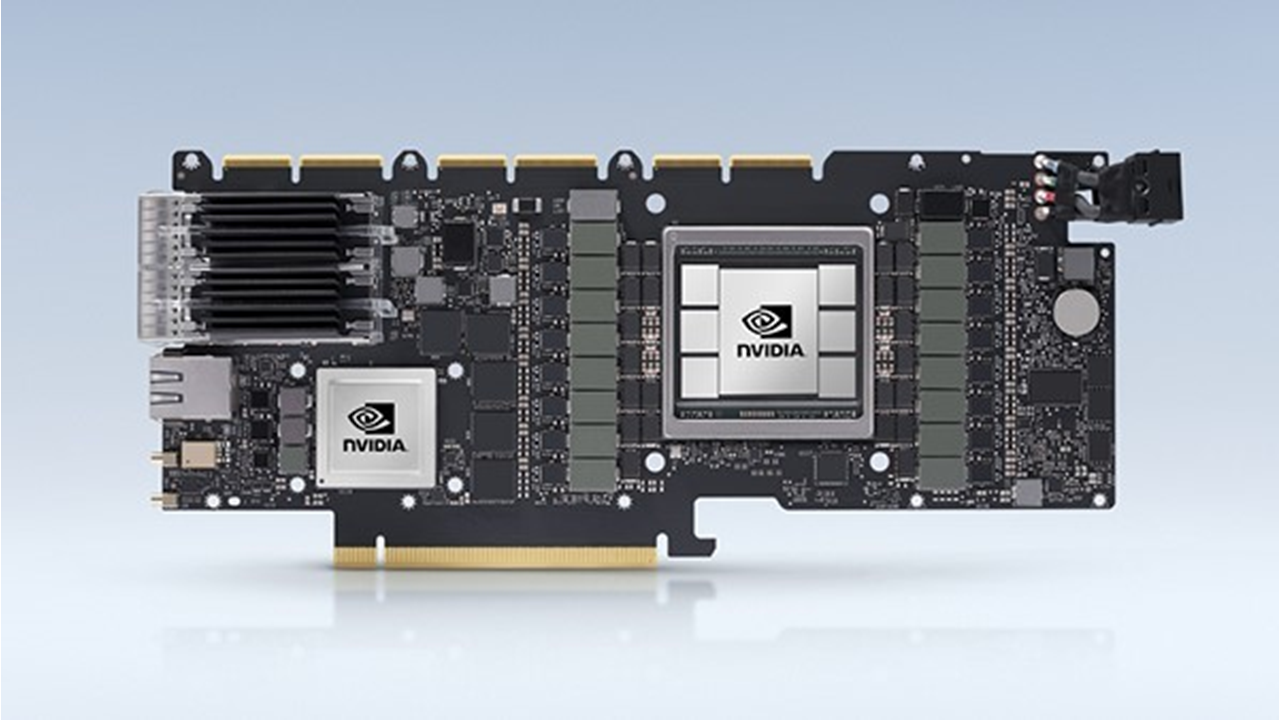
 Developing and application and offloading it in two ways, via DPDK and via DOCA libraries, to run on the BlueField Data Processing Unit