
 How to optimize DX12 resource uploads from the CPU to the GPU over the PCIe bus is an old problem with many possible solutions, each with their pros and cons. In this post, I show how moving cherry-picked DX12 UPLOAD heaps to CPU-Visible VRAM (CVV) using NVAPI can be a simple solution to speed up … Continued
How to optimize DX12 resource uploads from the CPU to the GPU over the PCIe bus is an old problem with many possible solutions, each with their pros and cons. In this post, I show how moving cherry-picked DX12 UPLOAD heaps to CPU-Visible VRAM (CVV) using NVAPI can be a simple solution to speed up PCIe limited workloads.
CPU-Visible VRAM: A new tool in the toolbox
Take the example of a vertex buffer (VB) upload, for which the data cannot be reused across frames. The simplest way to upload a VB to the GPU is to read the CPU memory directly from the GPU:
- First, the application creates a DX12 UPLOAD heap, or an equivalent CUSTOM heap. DX12 UPLOAD heaps are allocated in system memory, also known as CPU memory, with WRITE_COMBINE (WC) pages optimized for CPU writes. The CPU writes the VB data to this system memory heap first.
- Second, the application binds the VB within the UPLOAD heap to a GPU draw command, by using an IASetVertexBuffers command.
When the draw executes in the GPU, vertex shaders are launched. Next, the vertex attribute fetch (VAF) unit reads the VB data through the GPU’s L2 cache, which itself loads the VB data from the DX12 UPLOAD heap stored in system memory:
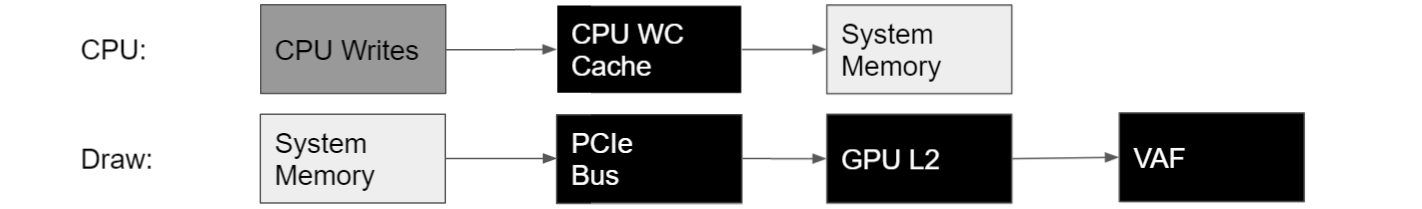
L2 accesses from system memory have high latency, so it is preferable to hide that latency by copying the data from system memory to VRAM before the draw command is executed.
The preupload from CPU to GPU can be done by using a copy command, either asynchronously by using a COPY queue, or synchronously on the main DIRECT queue.
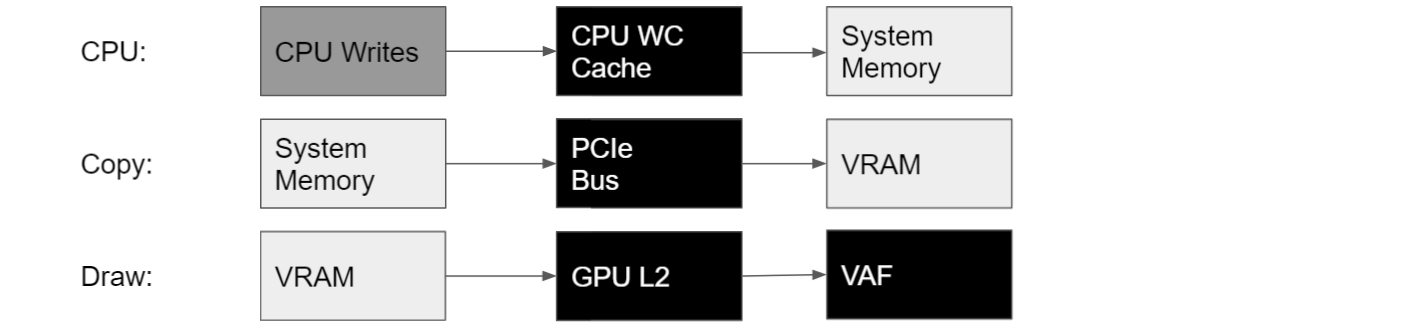
Copy engines can execute copy commands in a COPY queue concurrently with other GPU work, and multiple COPY queues can be used concurrently. One problem with using async COPY queues though is that you must take care of synchronizing the queues with DX12 Fences, which may be complicated to implement and may have significant overhead.
In the The Next Level of Optimization Advice with Nsight Graphics: GPU Trace session at GTC 2021, we announced that an alternative solution for DX12 applications on NVIDIA GPUs is to effectively use a CPU thread as a copy engine. This can be achieved by creating the DX12 UPLOAD heap in CVV by using NVAPI. CPU writes to this special UPLOAD heap are then forwarded directly to VRAM, over the PCIe bus (Figure 3).
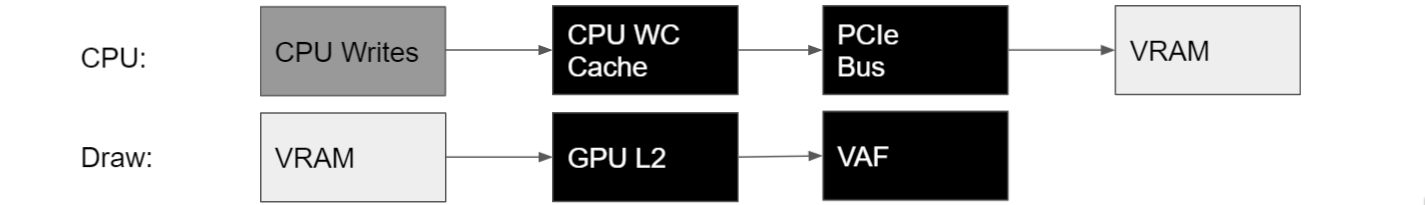
For DX12, the following NVAPI functions are available for querying the amount of CVV available in the system, and for allocating heaps of this new flavor (CPU-writable VRAM, with fast CPU writes and slow CPU reads):
NvAPI_D3D12_QueryCpuVisibleVidmemNvAPI_D3D12_CreateCommittedResourceNvAPI_D3D12_CreateHeap2
These new functions require recent drivers: 466.11 or later.
NvAPI_D3D12_QueryCpuVisibleVidmem should report the following amount of CVV memory:
- 200-256 MB for NVIDIA RTX 20xx and 30xx GPUs with Windows 11 (for instance, with the Windows 11 Insider Preview).
- More than 256 MB for NVIDIA RTX 30xx GPUs with Windows 10 or 11 with Resizable BAR reported as Yes in the NVIDIA Control Panel. For more information about how to enable Resizable BAR, see GeForce RTX 30 Series Performance Accelerates With Resizable BAR Support.
Detecting and quantifying GPU performance-gain opportunities from CPU-Visible VRAM using Nsight Graphics
The GPU Trace tool within NVIDIA Nsight Graphics 2021.3 makes it easy to detect GPU performance-gain opportunities. When Advanced Mode is enabled, the Analysis panel within GPU Trace color codes perf markers within the frame based on the projected frame-reduction percentage by fixing a specific issue in this GPU workload.
Here’s how it looks like for a frame from a prerelease build of Watch Dogs: Legion (DX12), on NVIDIA RTX 3080, after choosing Analyze:
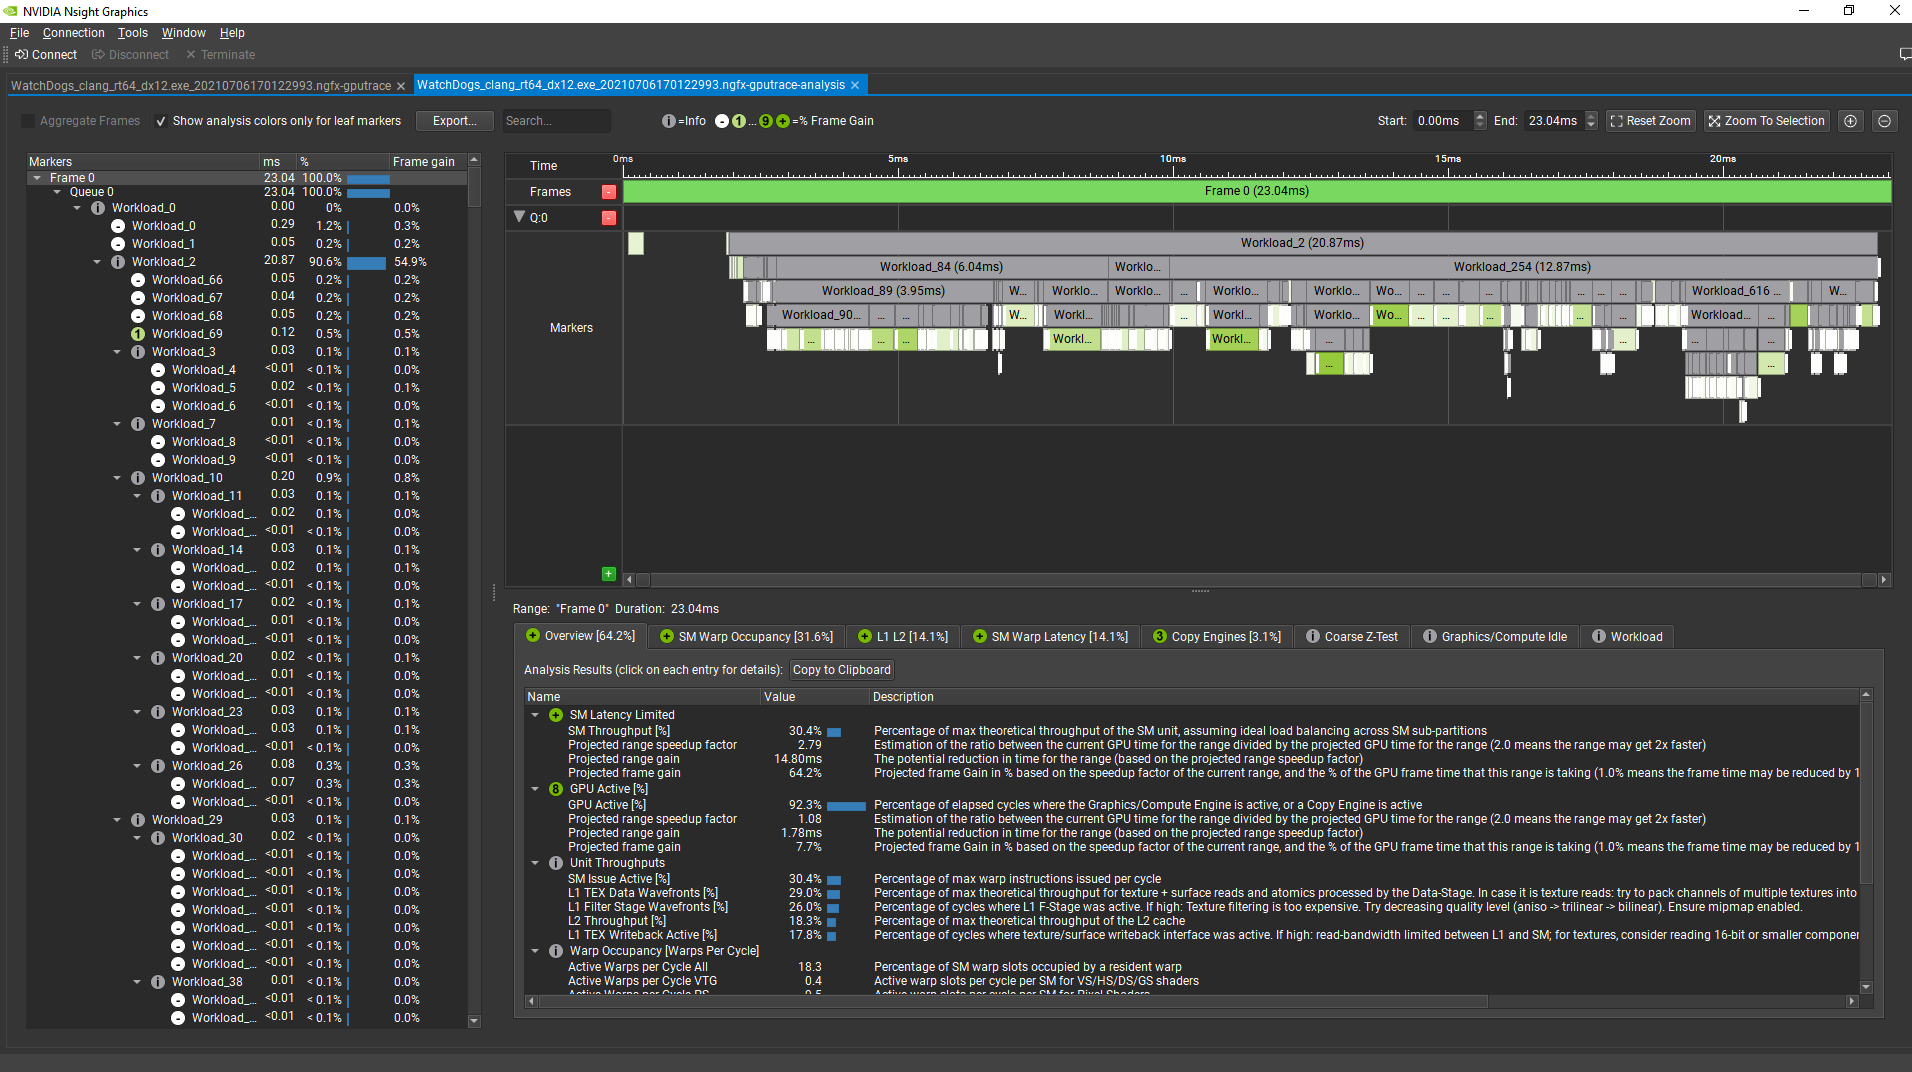
(the greener, the higher the projected gain on the frame).
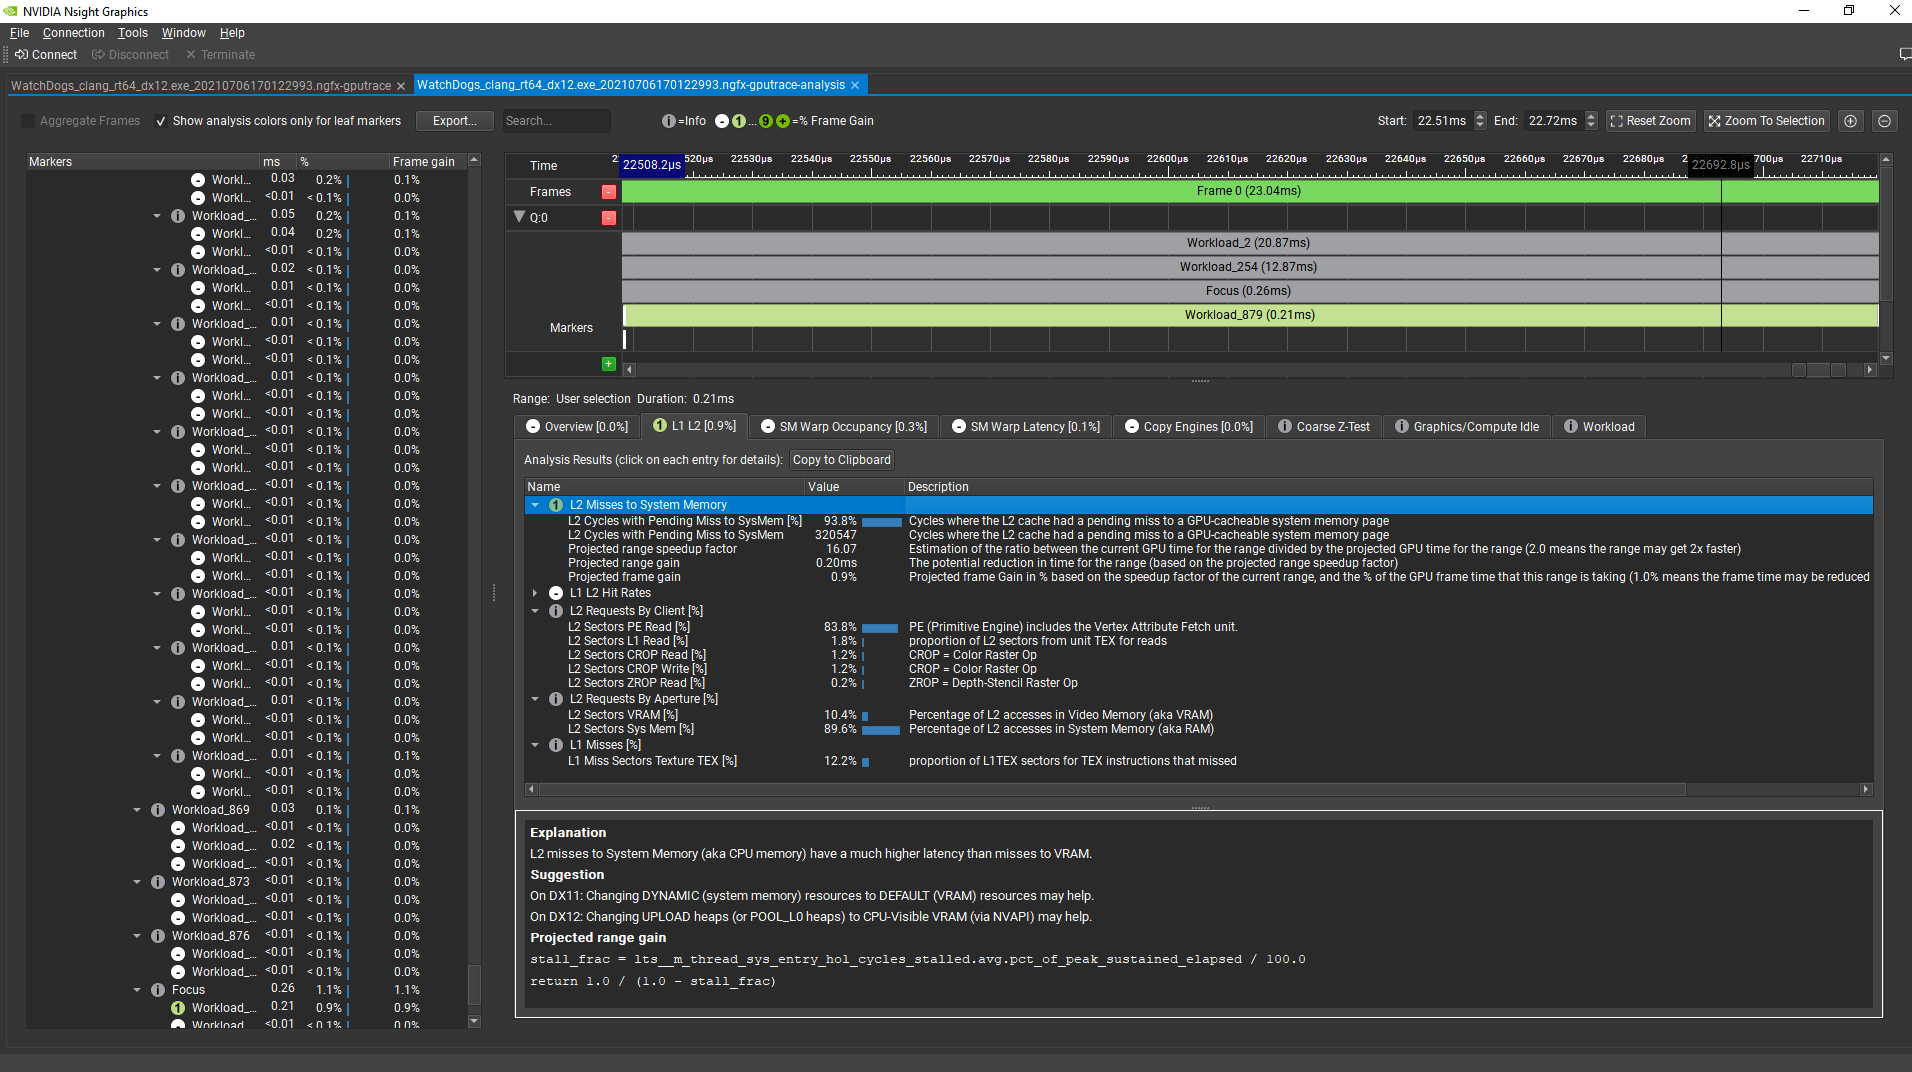
Now, selecting a user interface draw command at the end of the frame, the analysis tool shows that there is a 0.9% projected reduction in the GPU frame time from fixing the L2 Misses To System Memory performance issue. The tool also shows that most of the system memory traffic transiting through the L2 cache is requested by the Primitive Engine, which includes the vertex attribute fetch unit:
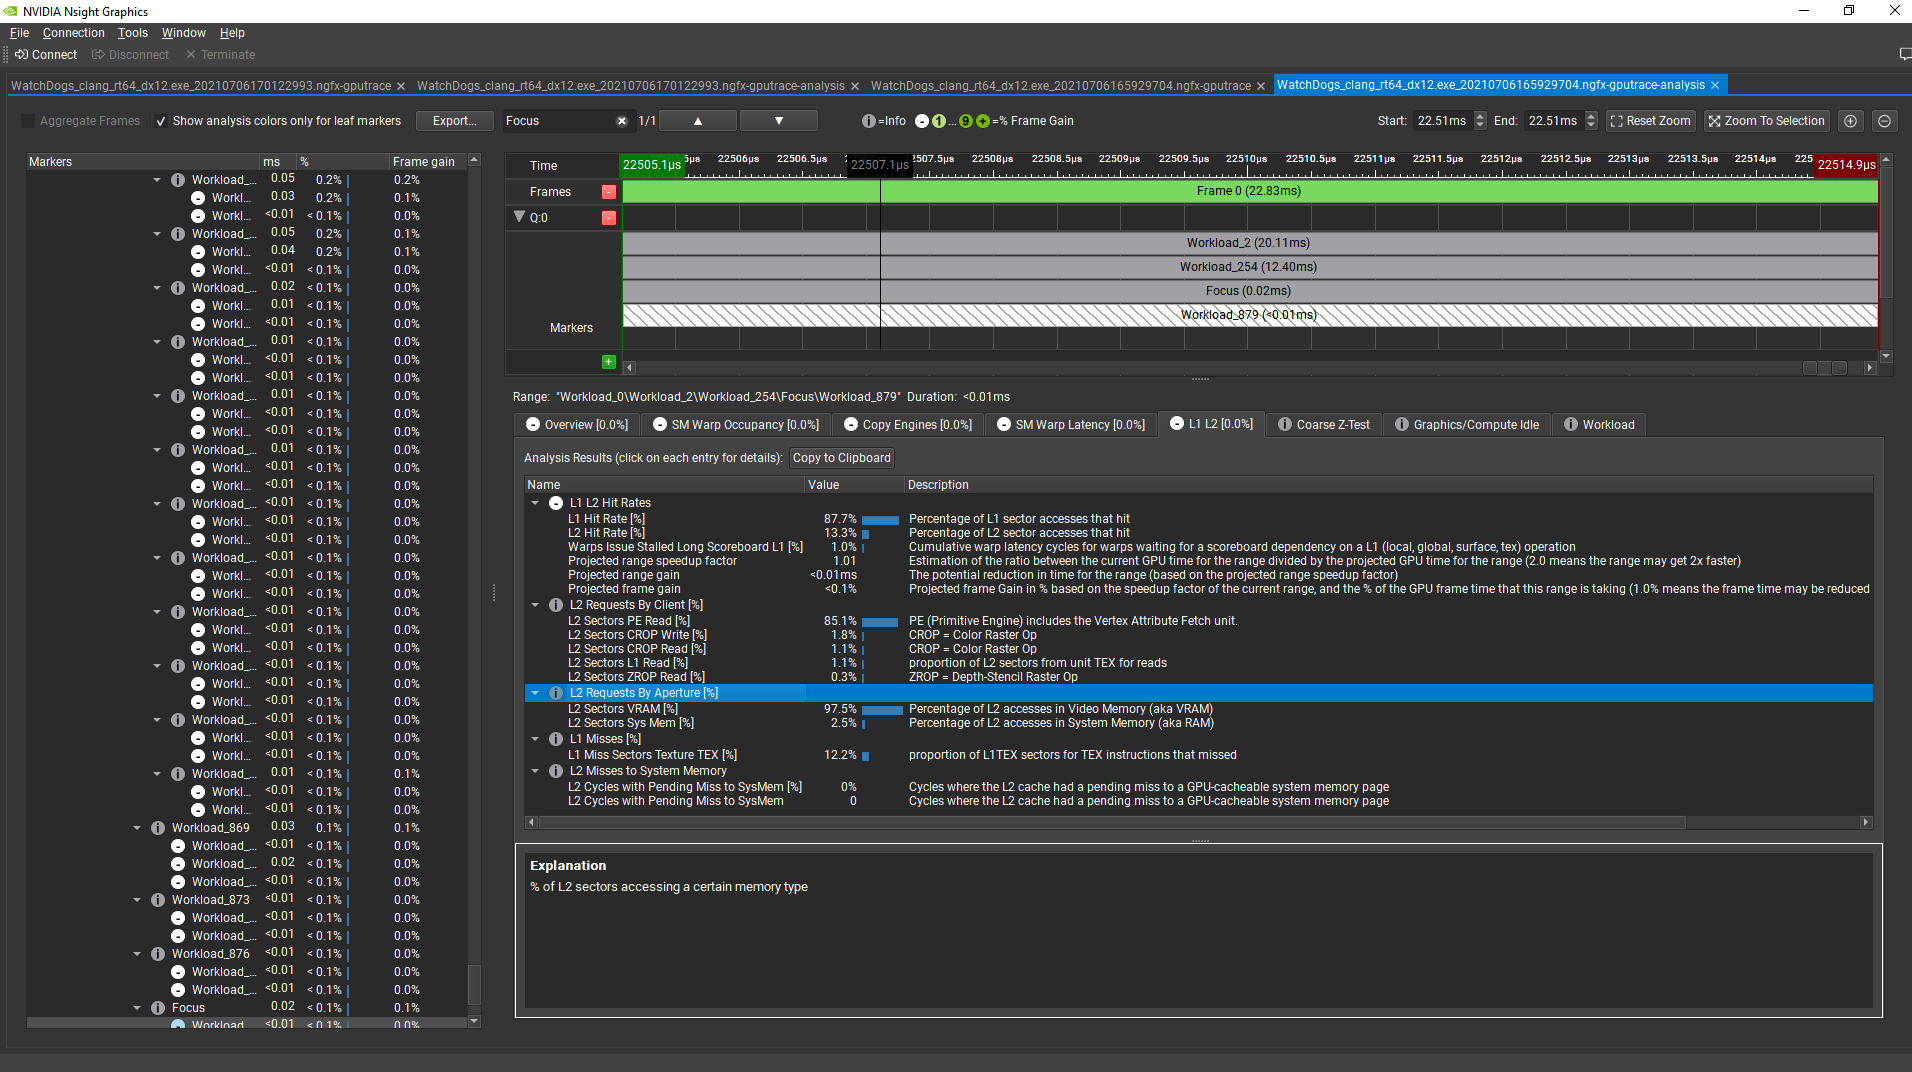
By allocating the VB of this draw command in CVV instead of system memory using a regular DX12 UPLOAD heap, the GPU time for this regime went from 0.2 ms to under 0.01 ms. The GPU frame time was also reduced by 0.9%. The VB data is now fetched directly from VRAM in this workload:
Avoiding CPU reads from CPU-Visible VRAM using Nsight Systems
Regular DX12 UPLOAD heaps are not supposed to be read by the CPU but only written to. Like the regular heaps, CPU memory pages for CVV heaps have write combining enabled. That provides fast CPU write performance, but slow uncached CPU read performance. Moreover, because CPU reads from CVV make a round-trip through PCIe, GPU L2, and VRAM, the latencies of reads from CVV is much greater than the latency of reads from regular DX12 upload heaps.
To detect whether an application CPU performance is negatively impacted by CPU reads from CVV and to get information on what CPU calls are causing that, I recommend using Nsight Systems 2021.3.
Example 1: CVV CPU Reads through ReadFromSubresource
Here’s an example of a disastrous CPU read from a DX12 ReadFromSubresource, in a Nsight Systems trace. For capturing this trace, I enabled the new Collect GPU metrics option in the Nsight Systems project configuration when taking the trace, along with the default settings, which include Sample target process.
Here is what Nsight Systems shows after zooming in on one representative frame:
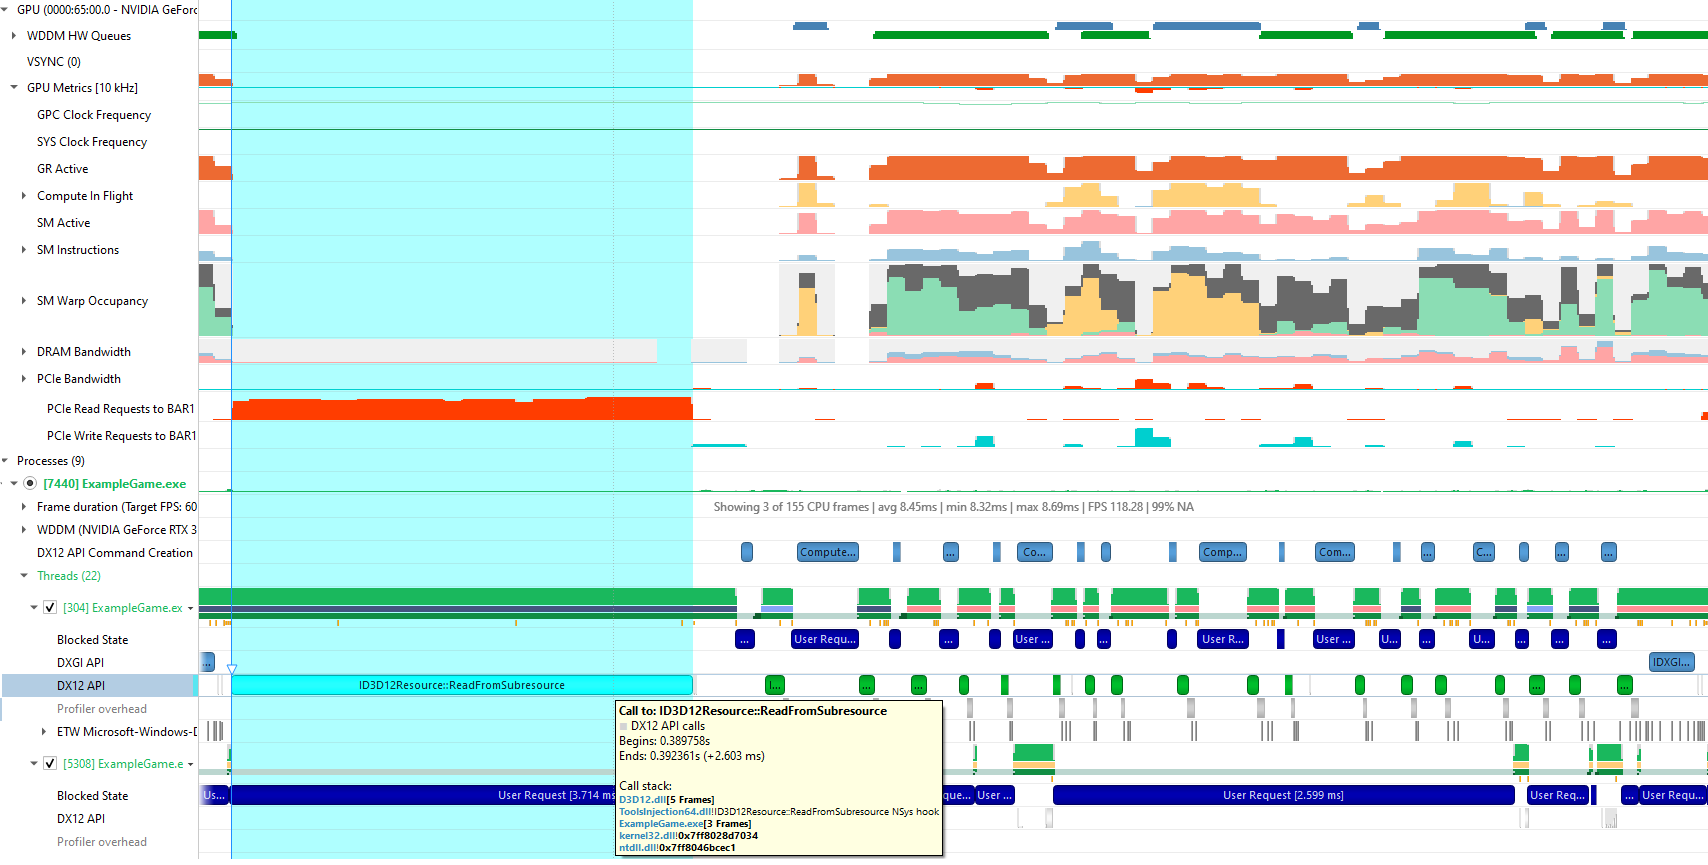
In this case (a single-GPU machine), the PCIe Read Requests to BAR1 GPU metric in Nsight Systems measures the number of CPU read requests sent to PCIe for a resource allocated in CVV (BAR1 aperture). Nsight Systems shows a clear correlation between a long DX12 ReadFromSubresource call on a CPU thread and a high number of PCIe read requests from CVV. So you can conclude that this call is most likely doing a CPU readback from CVV, and fix that in the application.
Example 2: CVV CPU reads from a mapped pointer
CPU reads from CVV are not limited to DX12 commands. They can happen in any CPU thread when using any CPU memory pointer returned by a DX12 resource Map call. That is why using Nsight Systems is recommended for debugging them, because Nsight Systems can periodically sample call stacks per CPU thread, in addition to selected GPU hardware metrics.
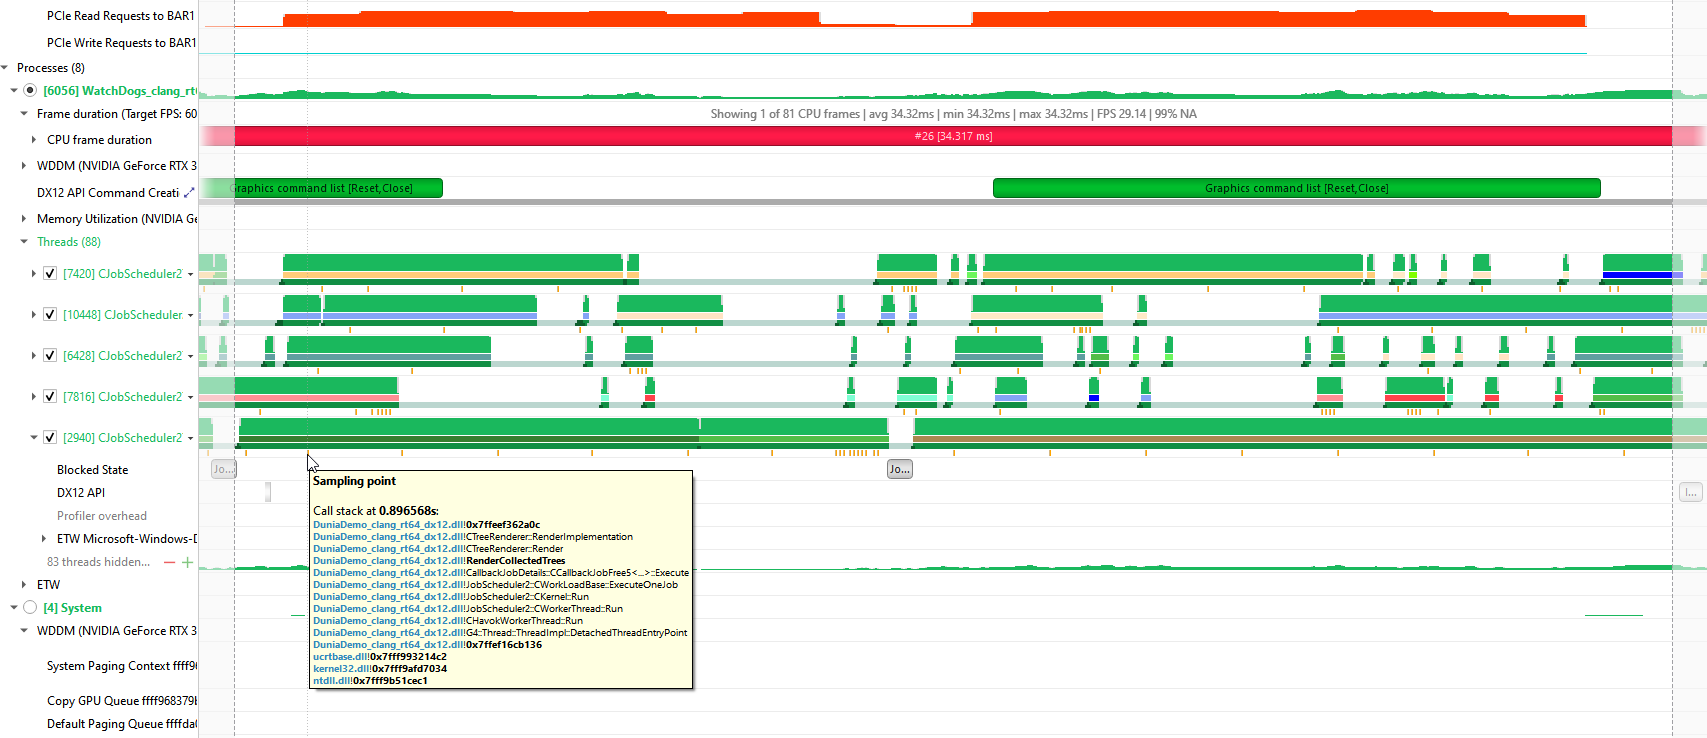
Here is an example of Nsight Systems showing CPU reads from CVV correlated with no DX12 API calls, but with the start of a CPU thread activity:
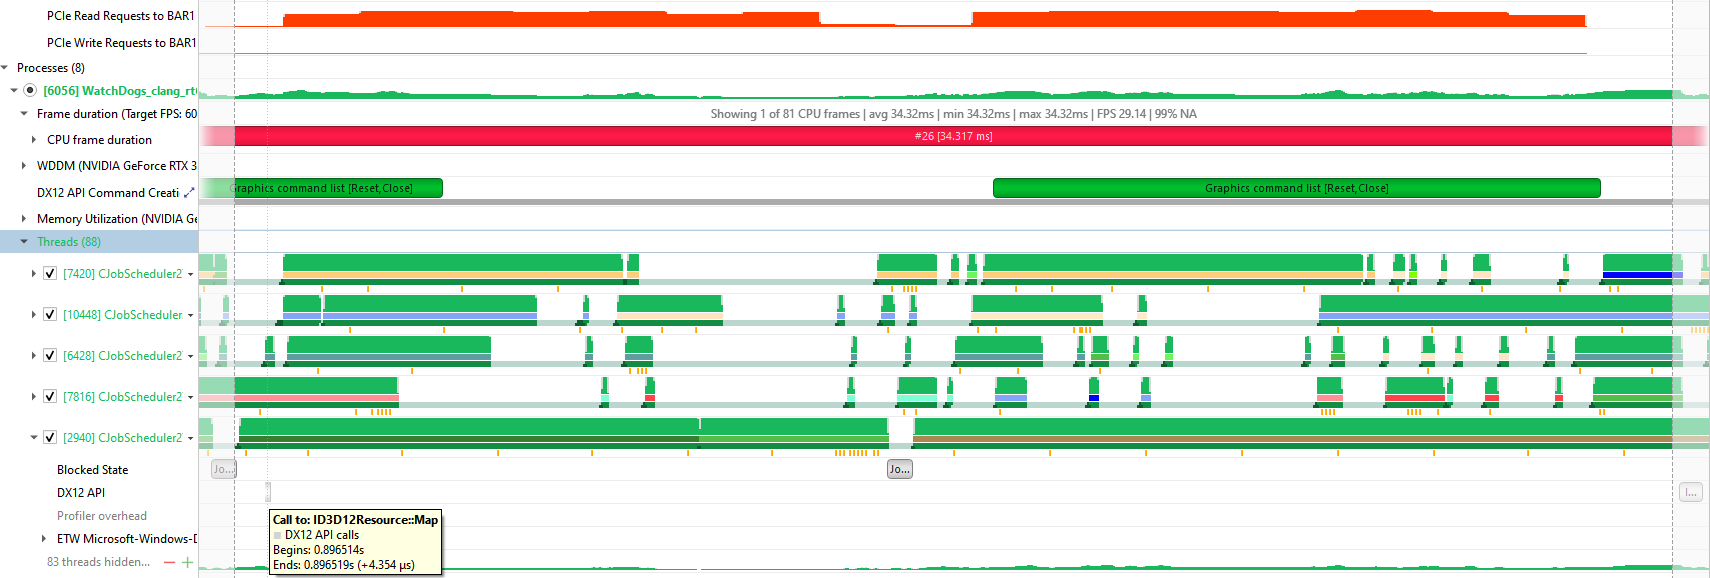
By hovering over the orange sample points right under the CPU thread, you see that this thread is executing a C++ method named RenderCollectedTrees, which can be helpful to locate the code that is doing read/write operations to the CVV heap:
One way to improve the performance in this case would be to perform the read/write accesses to a separate chunk of CPU memory, not in a DX12 UPLOAD heap. When all read/write updates are finished, do a memcpy call from the CPU read/write memory to the UPLOAD heap.
Conclusion
All PC games running on Windows 11 PCs can use 256 MB of CVV on NVIDIA RTX 20xx and 30xx GPUs. NVAPI can be used to query the total amount of available CVV memory in the system and to allocate DX12 memory in this space. This makes it possible to replace DX12 UPLOAD heaps with CVV heaps by simply changing the code that allocates the heap, if the CPU never reads from the original DX12 UPLOAD heap.
To detect GPU performance-gain opportunities from moving a DX12 UPLOAD heap to CVV, I recommend using the GPU Trace Analysis tool, which is part of Nsight Graphics. To detect and debug CPU performance loss from reading from CVV, I recommend using Nsight Systems with its GPU metrics enabled.
Acknowledgments
I would like to acknowledge the following NVIDIA colleagues, who have contributed to this post: Avinash Baliga, Dana Elifaz, Daniel Horowitz, Patrick Neill, Chris Schultz, and Venkatesh Tammana.