
 GPUs are specially designed to crunch through massive amounts of data at high speed. They have a large amount of compute resources, called streaming…
GPUs are specially designed to crunch through massive amounts of data at high speed. They have a large amount of compute resources, called streaming multiprocessors (SMs), and an array of facilities to keep them fed with data: high bandwidth to memory, sizable data caches, and the capability to switch to other teams of workers (warps) without any overhead if an active team has run out of data.
Yet data starvation may still occur, and much of code optimization focuses on that issue. In some cases, SMs are starved not for data, but for instructions. This post presents an investigation of a GPU workload that experiences a slowdown due to instruction cache misses. It describes how to identify this bottleneck, as well as techniques for removing it to improve performance.
Recognizing the problem
The origin of this investigation is an application from the domain of genomics in which many small, independent problems related to aligning small sections of a DNA sample with a reference genome need to be solved. The background is the well-known Smith-Waterman algorithm (but that by itself is not important for the discussion).
Running the program on a medium-sized dataset on the powerful NVIDIA H100 Hopper GPU, with 114 SMs, showed good promise. The NVIDIA Nsight Compute (NCU) tool, which analyzes a program’s execution on the GPU, confirmed that the SMs were quite busy with useful computations, but there was a snag.
So many of the small problems composing the overall workload—each handled by its own thread—could be run on the GPU simultaneously that not all compute resources were fully used all the time. This is expressed as a small and non-integral number of waves. Work for the GPU is divided into chunks called thread blocks, and one or more can reside on an SM. If some SMs receive fewer thread blocks than others, they will run out of work and must idle while the other SMs continue working.
Filling up all SMs completely with thread blocks constitutes one wave. NCU dutifully reports the number of waves per SM. If that number happens to be 100.5, it means that not all SMs have the same amount of work to do, and that some are forced to idle. But the impact of the uneven distribution is not substantial. Most of the time, the load on the SMs is balanced. That situation changes if the number of waves is just 0.5, for example. For a much larger percentage of the time, SMs experience an uneven work distribution, which is called the “tail” effect.
Addressing the tail effect
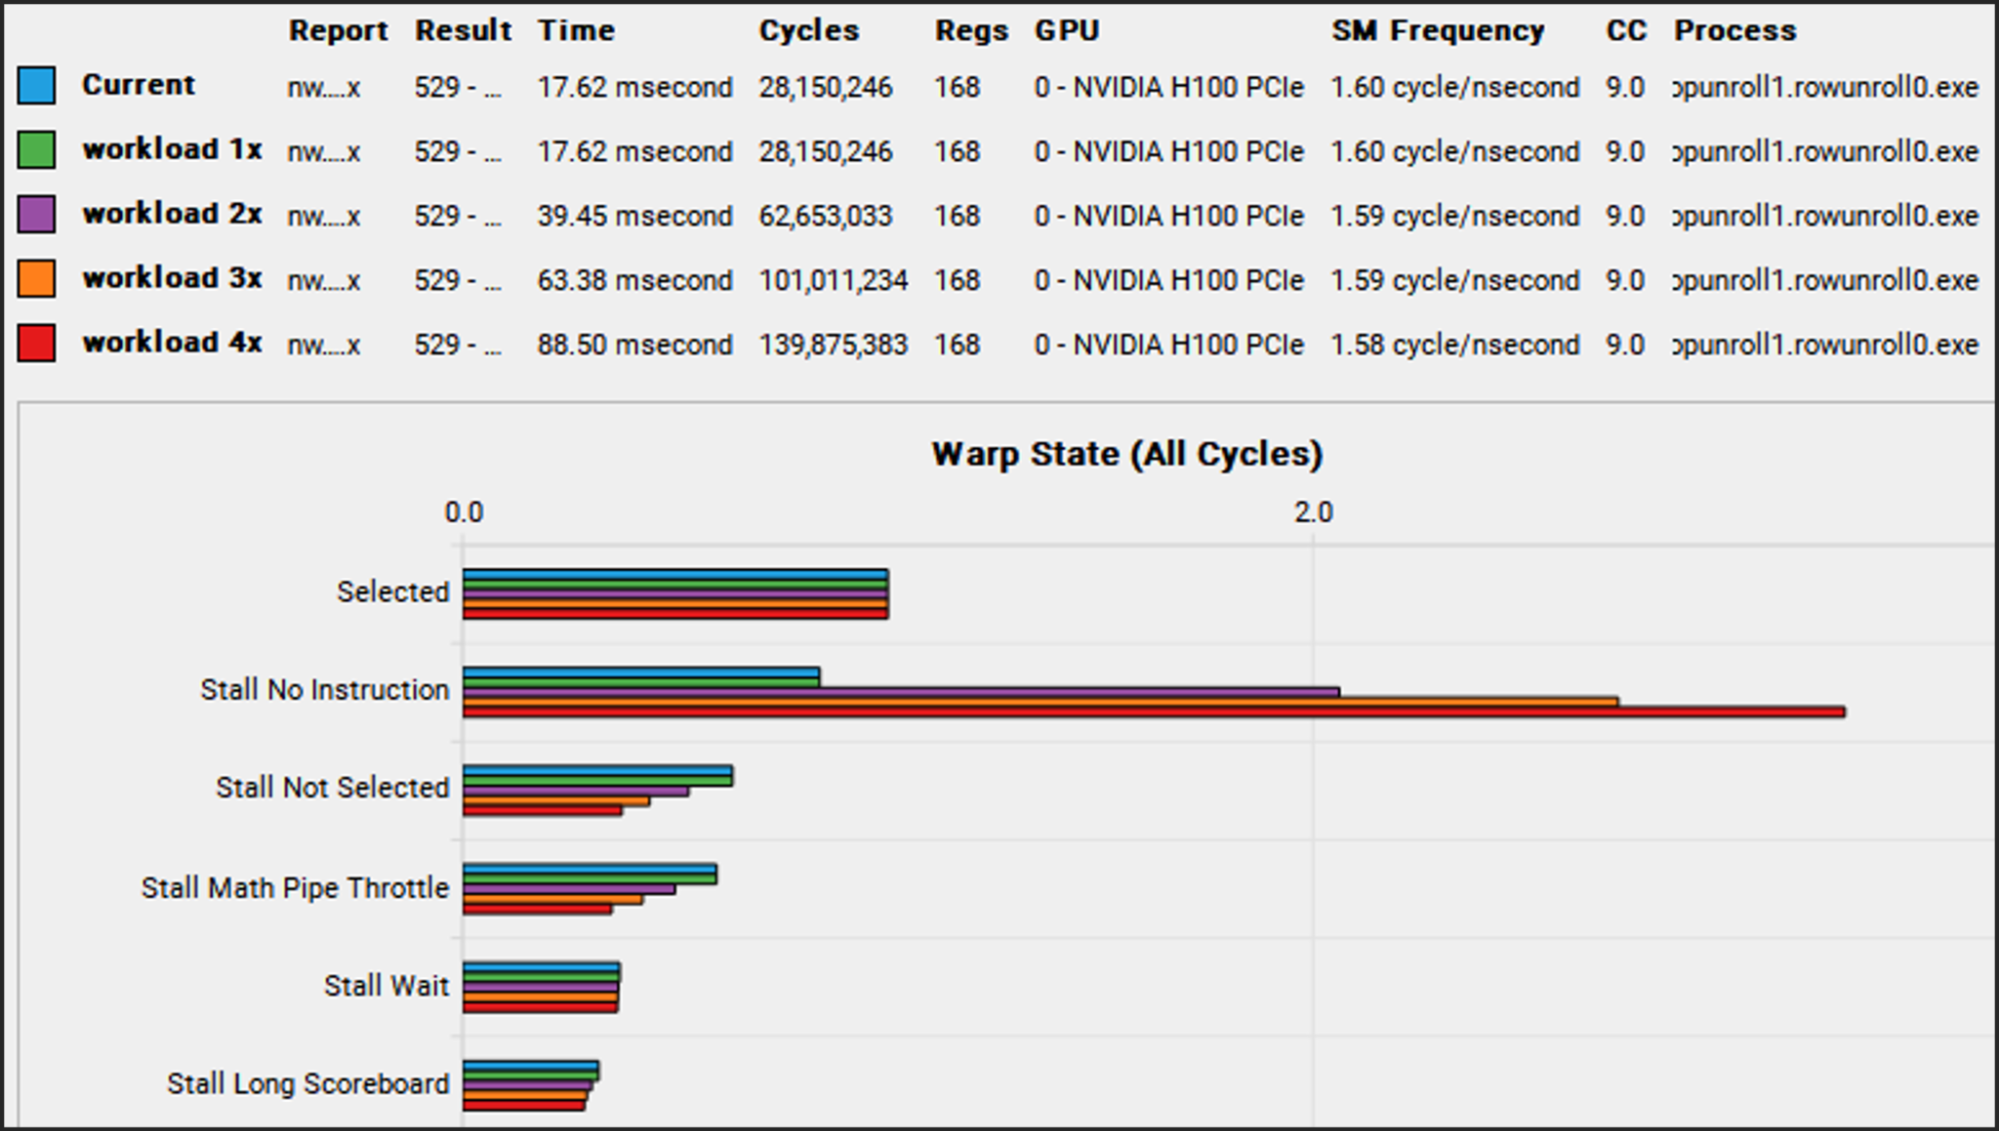
This phenomenon is exactly what materialized with the genomics workload. The number of waves was just 1.6. The obvious solution is to give the GPU more work to do (more threads, leading to more warps of 32 threads each), which is usually not a problem. The original workload was relatively modest, and in a practical environment larger problems need to be completed. However, increasing the workload (1x) by doubling (2x), tripling (3x), and quadrupling (4x) the number of subproblems saw performance deteriorate rather than improve. What could cause this outcome?
The combined NCU report of those four workload sizes sheds light on the situation. In the section called Warp State, which lists the reasons threads cannot make progress, the value for ‘No Instruction’ stands out for increasing significantly with workload size (Figure 1).
‘No Instruction’ means the SMs could not be fed instructions fast enough from memory. ‘Long Scoreboard’ indicates the SMs could not be fed data fast enough from memory. Fetching instructions on time is so critical that the GPU provides a number of stations where instructions can be placed once they have been fetched to keep them close to the SMs. Those stations are called instruction caches, and there are even more levels of them than data caches.
To understand where the instruction caching bottleneck occurred, our team ran the same workloads again, but this time instructed NCU to gather more information than before, using a feature called Metrics. This feature is used to specify a user-defined list of performance counters that are not included in the regular performance reports. In this particular case, a broad array of counters was used related to instruction caches:
gcc__raw_l15_instr_hit, gcc__raw_l15_instr_hit_under_miss, gcc__raw_l15_instr_miss, sm__icc_requests, sm__icc_requests_lookup_hit, sm__icc_requests_lookup_miss, sm__icc_requests_lookup_miss_covered, sm__icc_requests_lookup_miss_to_gcc, sm__raw_icc_covered_miss, sm__raw_icc_covered_miss_tpc, sm__raw_icc_hit, sm__raw_icc_hit_tpc, sm__raw_icc_request_tpc_1b_apm, sm__raw_icc_true_hits_tpc_1b_apm, sm__raw_icc_true_miss, sm__raw_icc_true_miss_tpc, sm__raw_icc_unlock_all_tpc, sm__raw_l0icache_hits_sctlall, sm__raw_l0icache_requests_sctlall, sm__raw_l0icache_requests_to_icc_sctlall, smsp__l0icache_fills, smsp__l0icache_requests, smsp__l0icache_requests_hit, smsp__l0icache_requests_miss, smsp__raw_l0icache_hits, smsp__raw_l0icache_requests_to_icc
The result is that of all the measured quantities, the relatively costly icc cache misses, in particular, increase disproportionately with increasing workload size (Figure 2). The icc cache is an instruction cache that resides in the SM itself and is very close to the actual instruction execution engine.
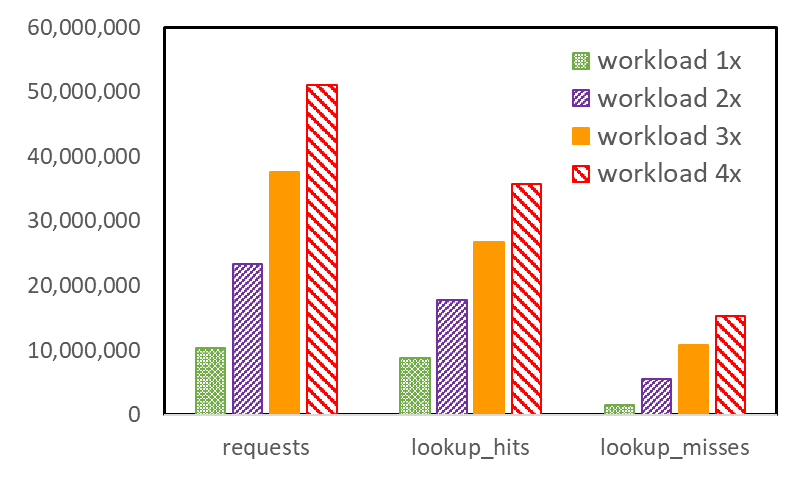
The fact that icc misses increase so quickly implies that, first, not all instructions in the busiest part of the code fit in icc. Second, the need for more different instructions increases as the workload size increases. The reason for the latter is somewhat subtle. Multiple thread blocks, composed of warps, reside on the SM simultaneously, but not all warps execute simultaneously.
The SM is internally divided into four partitions, each of which can generally execute one warp instruction per clock cycle. When a warp is stalled for any reason, another warp that also resides on the SM can take over. Each warp can execute its own instruction stream independently from other warps. At the start of the main kernel in this program, warps running on each SM are mostly in sync. They start with the first instruction and keep chugging along.
However, they are not explicitly synchronizing, and as time goes on and warps take turns idling and executing, they will drift further and further apart in terms of the instructions they execute. This means that a growing set of different instructions must be active as the execution progresses, and this in turn means that the icc overflows more frequently. Instruction cache pressure builds, and more misses occur.
Solving the problem
The gradual drifting apart of the warp instruction streams cannot be controlled, except by synchronizing the streams. But synchronization typically reduces performance, because it requires warps to wait for each other when there is no fundamental need. However, decreasing the overall instruction footprint can be attempted, such that instruction spilling from icc occurs less frequently, and perhaps not at all.
The code in question contains a collection of nested loops, and most of the loops are unrolled. Unrolling improves performance by enabling the compiler to:
- Reorder (independent) instructions for better scheduling
- Eliminate some instructions that can be shared by successive iterations of the loop
- Reduce branching
- Allocate different registers to the same variable referenced in different iterations of the loop, to avoid having to wait for specific registers to become available
Unrolling loops brings many benefits, but it does increase the number of instructions. It also tends to increase the number of registers used, which may depress performance, because fewer warps may reside on the SMs simultaneously. This reduced warp occupancy comes with less latency hiding.
The two outermost loops of the kernel are the focus. Practical unrolling is best left to the compiler, which has myriad heuristics to generate good code. That is, the user expresses that there is an expected benefit of unrolling by using hints, called pragmas in C++, before the top of the loop. These take the following form:
#pragma unroll XWhere X can be blank (canonical unroll), the compiler is only told that unrolling may be beneficial, but is not given any suggestion how many iterations to unroll. Or it can be (n), where n is a positive number that suggests unrolling in groups of n iterations. For convenience, the following notation has been adopted. An unroll factor of 0 means no unroll pragma at all, an unroll factor of 1 means an unroll pragma without any number (canonical), and an unroll factor of n that is larger than 1 means:
#pragma unroll (n)The next experiment comprises a suite of runs in which the unroll factor varies between 0 and 4 for both levels of the two outermost loops in the code, producing a performance figure for each of the four workload sizes. Unrolling by more is not needed because experiments show that the compiler does not generate different code for higher unroll factors for this particular program. Figure 3 shows the outcome of the suite.
The top horizontal axis shows unroll factors for the outermost loop (top level). The bottom horizontal axis shows unroll factors for the second-level loop. Each point on any of the four performance curves (higher is better) corresponds to two unroll factors, one for each of the outermost loops as indicated on the horizontal axes.
Figure 3 also shows, for each instance of unroll factors, the size of the executable in units of 500 KB. While the expectation might be to see increasing executable sizes with each higher level of unrolling, that is not consistently the case. Unroll pragmas are hints that may be ignored by the compiler if they are not deemed beneficial.
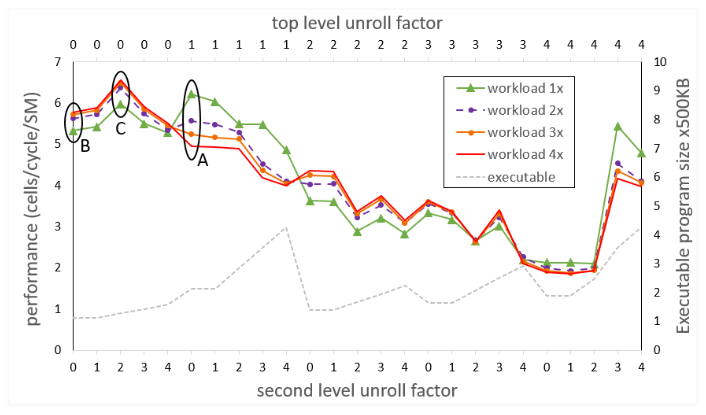
Measurements corresponding to the initial version of the code (indicated by the ellipse labeled A) are for the canonical unrolling of the top-level loop, and no unrolling of the second-level loop. The anomalous behavior of the code is apparent, where larger workload sizes lead to poorer performance, due to increasing icc misses.
In the next isolated experiment (indicated by the ellipse labeled B), attempted before the full suite of runs, neither of the outermost loops is unrolled. Now the anomalous behavior is gone and larger workload sizes lead to the expected better performance. However, absolute performance is reduced, especially for the original workload (1x) size. Two phenomena, revealed by NCU, help explain this result. Due to the smaller instruction footprint, icc misses have dropped virtually to zero for all sizes of the workload. However, the compiler assigned a relatively large number of registers to each thread, such that the number of warps that can reside on the SM is not optimal.
Doing the full sweep of unroll factors suggests that the experiment in the ellipse labeled C is the proverbial sweet spot. It corresponds to no unrolling of the top-level loop, and unrolling by a factor of 2 of the second-level loop. NCU still shows virtually no icc misses, and a reduced number of registers per thread, such that more warps can fit on the SM than in experiment B, leading to more latency hiding.
While absolute performance of the smallest workload still lags by that of experiment A, the difference is not much, and larger workloads fare increasingly better, leading to the best average performance across all workload sizes.
Conclusion
Instruction cache misses can cause performance degradation for kernels that have a large instruction footprint, which is often caused by substantial loop unrolling. When the compiler is put in charge of unrolling through pragmas, the heuristics it applies to the code to determine the best actual level of unrolling are necessarily complicated and are not always predictable by the programmer. It may pay to experiment with different compiler hints regarding loop unrolling to arrive at the optimal code with good warp occupancy and reduced instruction cache misses.