This week’s GFN Thursday packs a prehistoric punch with the release of Jurassic World Evolution 2. It also gets infinitely brighter with the release of Bright Memory: Infinite. Both games feature NVIDIA RTX technologies and are part of the six titles joining the GeForce NOW library this week. GeForce NOW RTX 3080 members will get Read article >
Researchers tackling the challenge of visual misinformation — think the TikTok video of Tom Cruise supposedly golfing in Italy during the pandemic — must continuously advance their tools to identify AI-generated images. NVIDIA is furthering this effort by collaborating with researchers to support the development and testing of detector algorithms on our state-of-the-art image-generation models. Read article >
NVIDIA GTC is live and bustling, bringing together the world’s most brilliant and creative minds who shape our world with the power of AI, computer graphics and more. At the show, we announced new features for NVIDIA Omniverse, our real-time digital-twin simulation and collaboration platform for 3D workflows. These include Omniverse VR, Remote and Showroom, Read article >
With NVIDIA Omniverse, millions of developers around the world can now take their workflows to the next level. At GTC, we introduced exclusive events, sessions and other resources to showcase how we’re expanding Omniverse, the multi-GPU, real-time simulation, and reference development platform for 3D workflows. Our dedicated Developer Day was an exclusive event that offered Read article >
To better expose the 9,000+ members of NVIDIA Inception to venture capital funding, we’ve introduced a new program benefit to connect these startups with our rapidly growing community of 200 VCs and investors. The NVIDIA Inception VC Alliance will open new paths for startups to engage, create introductions and accelerate potential funding, which will facilitate Read article >
NVIDIA and Google Cloud are creating a bridge linking the tools of data science to the muscle of the cloud with one click. Most data scientists work in Jupyter Notebooks, open-source development environments that can run code, show visualizations and display text notes, too. But it can take many complex steps to move this rich Read article >
Amid increasing market volatility, financial risk managers are looking for faster, better market analytics. Today that’s served up by advanced risk algorithms running on the fastest parallel computing systems. Boosting the state of the art for risk platforms, NVIDIA DGX A100 systems running Red Hat software can offer financial services firms performance and operational gains. Read article >
Read a complete overview of the Nsight suite of developer tools with new features and capabilities.
The Nsight suite of Developer Tools provide insightful tracing, debugging, profiling, and other analyses to optimize your complex computational applications across NVIDIA GPUs, and CPUs including x86, Arm, and Power architectures.
Unlocking the Power of GPU Profiler and Debugger: Nsight Systems 2021.5 and Nsight Compute 2021.3
NVIDIA Nsight Systems is a performance analysis tool designed to visualize, analyze and optimize programming models, and tune to scale efficiently across any quantity, or size, of CPUs and GPUs; from workstations to supercomputers.
Nsight Systems 2021.5 highlights include:
Statistics now available in graphical user interface (GUI).
Multireport view with horizontal and vertical layouts to aid investigations across server nodes, VMs, containers, ranks, and processes (coming soon).
Expert system now includes GPU utilization analysis for OpenGL and DX12.
NVIDIA NIC InfiniBand metrics sampling (experimental).
DirectX12 memory operations and warnings.
DXGI/DX12/Vulkan API calls correlation to WDDM queue packets.
NVIDIA Nsight Compute 2021.3 released new features for measuring and modeling occupancy, source and assembly code correlation, and a hierarchical roofline model to identify bottlenecks caused by accessing cache memory.
Key features:
Occupancy Calculator – Helps you understand the hardware resource utilization of your kernels, and model how adjustments could impact occupancy.
Command line source page – enables accessing the information from the Source page in the GUI directly from the command line. By using the --page source flag, you can see the lines of source, PTX, or assembly and the collected metrics for those lines output on the command line. This feature gives additional flexibility when it comes to analyzing the collected data as well as scripting and post-processing results for further reporting and analysis.
Hierarchical Roofline – The Roofline chart now supports a hierarchical roofline, which represents additional levels in the memory hierarchy, in addition to device memory. You can now see if developed kernels have bottlenecks related to cache memory.
There are additional improvements including more configurable baseline comparisons, access to source-level information from the CLI, and additional SSH functionality.
What’s New for Gaming and Graphics Developers: Nsight Graphics 2021.5, Nsight Perf SDK, and Nsight Aftermath SDK
NVIDIA Nsight Graphics is a powerful tool that enables you to debug and profile applications that use Direct3D (11, 12, DXR), Vulkan (1.2, Vulkan Ray Tracing), and OpenGL. It provides the ability to export frames for later analysis, as well as GPU Trace, a powerful profiler that enables you to visualize GPU low-level metrics.
This latest Nsight Graphics 2021.5 release extends support for multiple APIs with the following updates:
Full Windows 11 support for both API Capture and Tracing.
NVIDIA Nsight Perf SDK is a graphics profiling toolbox for DirectX, Vulkan, and OpenGL, enabling you to collect GPU performance metrics directly from your application.
Key features:
Simplified APIs for HTML report generation.
Lower-level range profiling APIs, with utility libraries providing ease-of-use.
All of the preceding, usable in D3D11, D3D12, OpenGL, and Vulkan.
Samples illustrating use cases in 3D, Compute, and Ray Tracing.
NVIDIA Nsight Aftermath SDKis a simple library you integrate into your D3D12 or Vulkan game’s crash reporter to generate GPU “mini-dumps” when a TDR or exception occurs.
Key features:
Support for Windows 11 for Nsight Aftermath available with Nsight Graphics 2021.5.
Debug GPU exceptions through a detailed “mini-dump.”
Contains the state of GPU pipeline subunits at exception time.
Captures all active warps and current PCs.
Map warp locations back to original HLSL/GLSL source code.
Use markers to pinpoint the exception location in the API call stream.
Helpful for debugging GPU exceptions during development, while in QA, or from deployed applications.
Efficient Model Design for In-App DL Inference: Nsight Deep Learning Designer 2021.2
Nsight Deep Learning Designer, is the first in class, IDE tool for developers who want to incorporate high-performance DL-based features into their applications.
It enables in-depth analysis of end-to-end DL workflows for efficient model design.
This release includes new features:
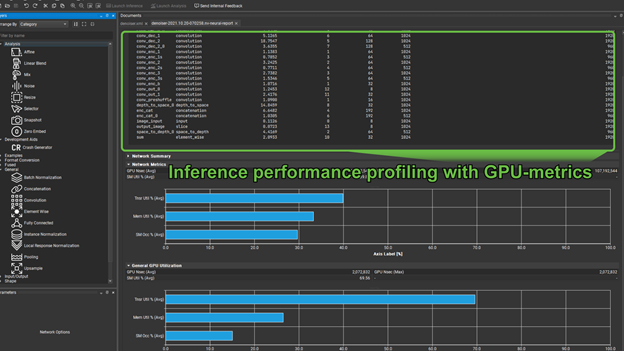
Inference performance profiling with GPU metrics and Tensor Core Utilization.
Analyze the model visually with the Channel Inspector.
Compatible with PyTorch.
Specialized Analysis Operators: Noise and Mix, Affine, Linear Blend, Resize, Selector, and many more.
Learn more details about Nsight DL Designer in this post.
Nsight Visual Studio 2021.3 release provides Windows 11 support for full-fledged GPU kernel debugging and code inspection for bottlenecks, system utilization, and throughput improvements.
Nsight Visual Studio is included in the CUDA® toolkit, release 11.5, with bug fixes and performance improvements.
Nsight Visual Studio Code Edition is an application development environment for heterogeneous platforms that brings CUDA® development for GPUs into Microsoft Visual Studio Code.
Nsight Visual Studio Code Edition 2021.1 release includes features like IntelliSense support for smart CUDA code completion, debug CPU and GPU code in single session, remote development for cluster environments, and more.
Nsight Eclipse Edition is a full-featured IDE powered by the Eclipse platform that provides an all-in-one integrated environment to edit, build, debug, and profile CUDA-C applications. Some key highlights include the ability to provide seamless CPU and CUDA debugging, native Eclipse plug-in, and docker container support.
With Linux Switch on Spectrum, Yandex gained transparency and control over the network, and disaggregated networking hardware and software, and lowered costs.
Picture this: you’re having dinner at an upscale restaurant. You look at the menu and decide that you’re in the mood for a filet. You order the steak medium rare. The waiter brings it out, it’s plated beautifully, and the service is great. Yet you hear a little voice in the back of your head. “I could have prepared this steak in my own kitchen exactly to my definition of medium rare!”
We’ve all had that feeling: to get that perfect outcome, sometimes you’ve got to put in some of the work yourself. Yandex recognized this, and that is why they have partnered with NVIDIA to use NVIDIA Linux Switch on NVIDIA Spectrum Ethernet switches. NVIDIA is uniquely positioned to enable and support pioneers like Yandex while they grow the open networking ecosystem.
Yandex is a Russian internet company. You could describe Yandex as a search engine much like Google, but they do much more than just search. Yandex provides many services to users: music and movie streaming, translation, intelligent personal assistants, and more.
As Anton Kortunov, networking lead at Yandex, explains, “Yandex has several data centers, with each data center containing tens or even hundreds of thousands of servers connected by thousands of switches. Managing this infrastructure is no small task.”
Yandex employs cloud operational models to make the deployment, administration, and automation of the data center as efficient and seamless as possible, at as low a cost as possible.
Technological considerations
In addition to the general requirements of cloud-scale efficiency and economy, Yandex had some key needs that had to be met by any networking solution they went with:
Their data centers make extensive use of IPv6; in particular, BGP sessions inside the fabric on IPv6 link-local addresses.
QoS and ACL tools were needed, and any networking stack had to integrate with telemetry, monitoring, and automation tools.
A network switch infrastructure that supported extensive ZTP, or zero touch provisioning. In particular, the ZTP needed to tie into the monitoring tools, to verify deployment and bring-up success at scale.
Looking at their requirements, Yandex evaluated several options. To do the desired integration and automation, Yandex determined they needed a truly open-source NOS. SONiC was considered but had too many limitations around IPv6 addressing. Enter NVIDIA Linux Switch.
What is Linux Switch?
NVIDIA Linux Switch allows customers to run any Linux distribution as the network operating system on Spectrum Ethernet switches. The secret sauce for Linux Switch is Switchdev, a Linux kernel driver model that Linux Switch is based on.
Much like in the server operating system case, Linux Switch is built for independence. Rather than using proprietary APIs, fully standard Linux kernel interfaces are used to control the switch silicon. This allows the switch and Linux distribution choice to be completely independent, with the switch hardware doing the heavy lifting through offloading.
Figure 1. NVIDIA Linux Switch stack
Linux Switch brings several key benefits to Yandex. As mentioned earlier, Yandex had some key technological requirements that had to be met with any networking OS. Linux Switch provides Yandex the flexibility to customize and optimize the switch to their exact needs, with no extra features driving up cost.
The transparency of Linux Switch and the Linux operating model also allows Yandex full visibility into the distribution, greatly simplifying troubleshooting and debugging. This enabled Yandex to integrate their networking infrastructure with tooling built in-house for automation and configuration management.
By combining the Linux Switch implementation with these custom tools, Yandex had complete control over the feature set without having to build an operating system from scratch.
Why NVIDIA?
As part of the Linux kernel, there is nothing that restricts Switchdev to the NVIDIA Spectrum Ethernet platform. What makes NVIDIA Linux Switch the right choice?
The answer is that the hardware matters. The NVIDIA software-defined, hardware-accelerated approach makes Spectrum a uniquely suitable fit for Switchdev. With each new ASIC and platform, Switchdev support and compatibility is one of the first considerations in the design stage, and every NVIDIA switch platform supports Linux Switch.
In addition, the breadth of switch port speeds (from 1 to 400G) and switch form factors (1/2U, as well as half-wide) enables the Spectrum portfolio to meet any data center networking need, Switchdev or otherwise.
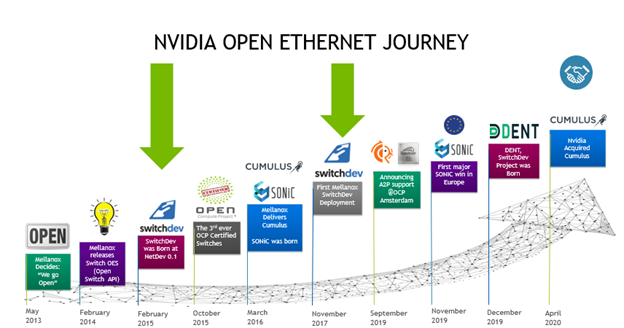
Complementing the optimized hardware portfolio, NVIDIA is a key member of the open-source networking ecosystem. NVIDIA works with the open-source community to support and triage customer issues. Linux Switch optimizations made by NVIDIA engineering are upstreamed as part of all major Linux distributions.
Figure 2. The NVIDIA Open Ethernet journey
With Linux Switch on Spectrum, Yandex gained transparency and control over the network, and disaggregated networking hardware and software, and lowered costs. As Kortunov puts it, “We met our overall goal of letting whitebox switches act like vendor boxes.” Yandex got all the positives of proprietary vendor solutions without all the associated negative baggage that comes along with proprietary lock-in.
To learn more about Yandex and their networking journey with NVIDIA, see the joint session as part of GTC. From November 8-11, GTC features hundreds of sessions packed with interesting insights and discoveries from NVIDIA customers and partners.
To attend the session with Anton Kortunov and David Iles, register for GTC. The Yandex session will be live on November 11 at 9 AM CET and will be available on-demand afterwards. Enjoy!
Technical overview of the Nsight DL Designer tool to help ease the process of performant model design.
NVIDIA Nsight Deep Learning Designer is a new tool that helps ease the process of performant model design. DL Designer provides valuable insights into the structure of the model, and how well it performs on NVIDIA hardware. Models can be created with a user-friendly, drag-and-drop interface that features nodes for all of the commonly used operators available in the most popular deep learning frameworks.
Performance profiling
Understanding the performance characteristics of a model is essential right from the outset. After the model is designed, you can profile it for performance.
To select and view the latest profiling report, choose Launch Inference, View, Inference Run Logger.
This is divided into two major sections. The first, shown previously, gives you a table of operators, their hyperparameters, and execution times. These are, by default, listed in order of priority to optimize (akin to how nvprof lists kernels in order of optimization priority).
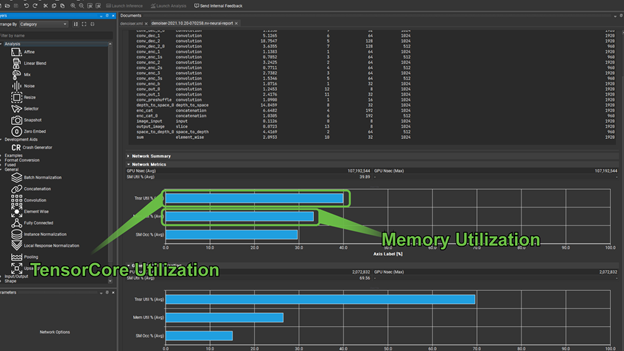
An important question for any model running on NVIDIA hardware, for both training and inference is, “Is this model using Tensor Cores”? The second part of the profiling report shows the utilization of Tensor Cores.
There are two groups of graphs here, the first gives you the Tensor Core utilization, along with memory throughput, and SM occupancy for the entire network. The second gives these same metrics for an individually selected operator from the preceding list. In cases where Tensor Core utilization is not meaningful, for example in the case of a pooling operator, the Tensor Core utilization shows as zero.
Memory utilization can quickly tell you if you are memory-bound. In cases such as this, it is prudent to look for opportunities to fuse operators where appropriate to use faster memory. Training time can be hugely reduced if you use the GPU hardware effectively. When training large models, or using cloud-based services, this can quickly translate into greatly reduced production costs.
Training the model
After you have profiled your model for performance improvements, you can export the model to PyTorch and perform training. Improvement areas can include ensuring FP16, when NHWC layout is used and you have at least multiples of eight input/output channels for your conv2d convolutions.
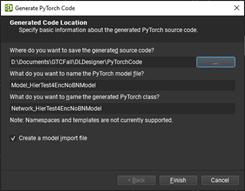
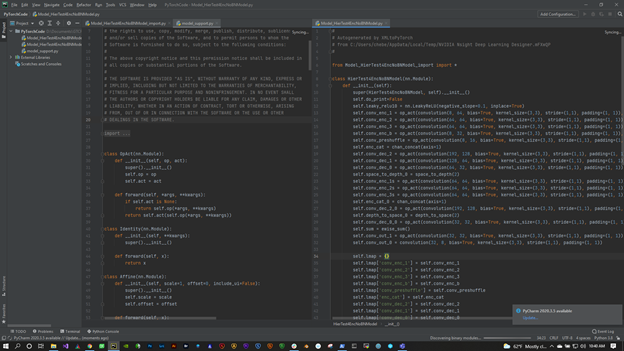
To export to PyTorch, choose File, Export, Generate PyTorch Files (Figure 3).
Figure 3. Generating PyTorch code from DL Designer
Exporting your model to PyTorch gives you a few options to check the names of the model, and files that are selected for you. But, you must specify an output directory for your PyTorch files, which consists of a trainable model and some utility methods to work with it.
To export to PyTorch, you must have a Python 3 environment in your PATH environment variable and the following modules:
PyTorch
Numpy
Pillow
Matplotlib
Fastprogress
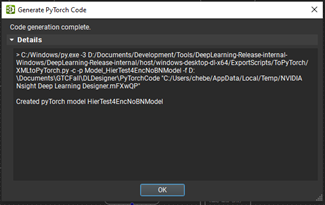
Upon successful generation, close the Code generation complete dialog box.
Figure 4. Completing your PyTorch code generation step.
Analyzing the model
Figure 5. Training model and applying weights to analyze performance.
Now your code is ready to work with! The next step is to get it trained and the weights loaded back into DL Designer so that you can analyze how well the model is performing the task for which it was designed.
The model here is a denoiser model. It is in the samples that you can try for yourself. The first thing to do is load it into DL Designer. Next get and apply the weights that you got from the training in PyTorch.
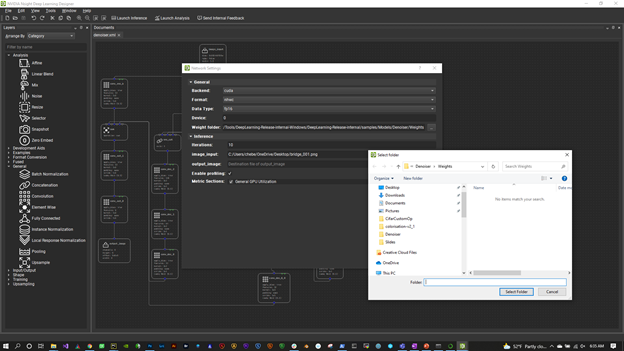
To configure the trained model, choose Tools, Network Settings.
Figure 6. Network Settings
The first thing to look at is the Weights Folder. Select the directory where you output your trained weights. DL Designer picks these up and applies them to the appropriate operators.
Also, make sure that you are set to FP16, NHWC layout, and the CUDA backend. To use the fast Tensor Cores for operations such as convolutions and GEMMs (matrix multiplications), use FP16. To get the fastest throughput, use NHWC.
Now, you can begin performing some visual analysis on the model. Before you do that, use some of the DL Designer analysis features and add a few handy nodes to the trained model to help you evaluate its performance as a denoiser.
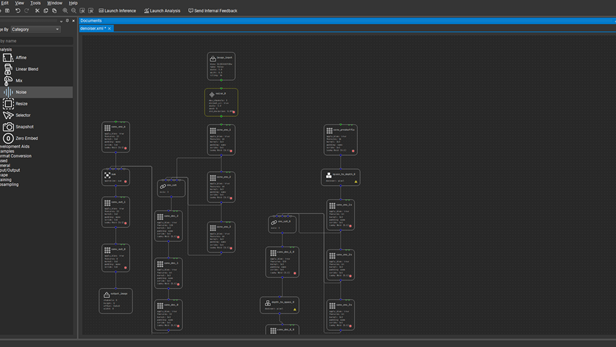
Analysis layers
Figure 7. View of the Analysis section of the Layers palette.
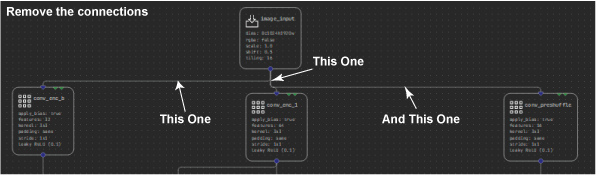
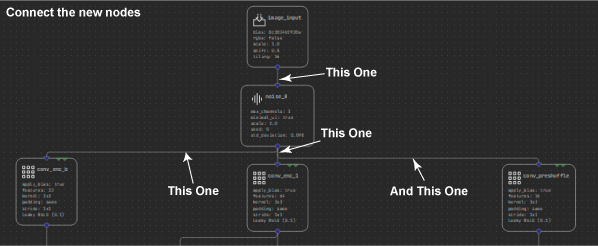
Start by expanding the Analysis section of the Layers palette. The first new layer to add is the Noise layer. This helps you inject some noise into the input image, so that you can evaluate how well the denoiser is reconstructing the image without it. To do this, first select and delete the connections between Input_image and the three nodes it connects with: conv_enc_b, conv_enc_1, and conv_preshuffle.
Figure 8. Adding a Noise layer to test the denoiser.
Now select and shift the image input node up a touch so that you can fit the noise layer in between. Finally, connect the input _image node to the new Noise layer, then connect the new layer to the three nodes that were previously connected from the image input. When you run this model, you can control how much noise to add to the image.
Figure 9. Connecting the Noise layer to the three nodes connected to input_image.
Before you run the analysis, there is one more node that you might find useful: the Mix node. This node enables you to compare the final denoised output with the original input, before the noise was added. As you see, you can perform this comparison in a variety of ways that give you a good idea as to how well your model is performing.
Delete the connection between conv_out_0 and output_image and then insert the Mix node in between these two, much like you did with the noise node by replacing the connections. I recommend caution as the mix node actually has two inputs.
You have already specified conv_out_0 as one input. Now add the other input to connect to the output of the original image layer, right at the top of the model, before you add the noise.
So far, you’ve added handy utilities to help analyze the model. At this point, save your model as denoiser_analyze.xml (or something similar) and choose Launch Analysis to see the model in action. Here is a quick breakdown of the user interface:
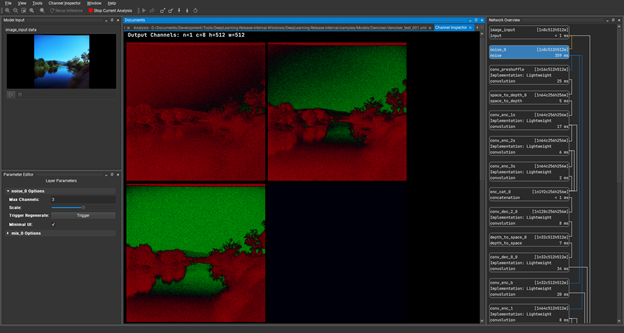
image_input_data—Right-click and choose Open Image Input to browse for a JPG or PNG file for use as the original input. When you choose Ok, the model springs into life and the output of the model is displayed in the central panel.
Noise and Mix—Options for the two analysis layers just added.
Network overview—The graph of nodes as they are being executed by the model inference.
Customizing design inspection
To continue, double-click on the Noise layer, which is the second layer down under Network Overview. Through the Channel Inspector under this tab, you can see the individual channels of the tensors that are produced during inference, which are the hidden layers. With the Noise layer channels in view, you can now go back to the noise layer options at the bottom right of the screen. Drag the Scale slider a little to the right and see the amount of noise showing on the image input increase.
Figure 10. Using the Channel Inspector feature to identify and distinguish individual channels of the tensors produced during inference
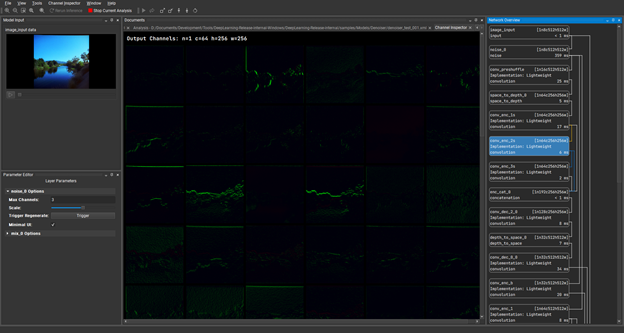
Under Channel Inspector, double-click the conv_enc_2s layer and load the channels of that hidden layer. This is showing the results of the convolution operation at the point during inference.
Figure 11. Channel inspector loading hidden layers as a result of a convolution operation at the point during inference
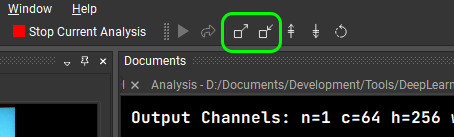
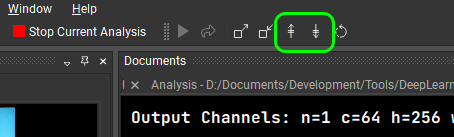
The features in these channels are a little faint, but you can boost them a bit by choosing the scale up icon (Figure 12).
Figure 12. Scaling up or down the channel brightness
This gives you a better idea of how these layers are performing and you can see clearly that there is nothing collapsing here. You have got strong signals propagating through the model. Any data displayed as green is positive in value and any data displayed as red is negative.
You can also shift the displayed values with the shift buttons, enabling you to push everything to display as positive or negative values.
Figure 13. Shift the displayed values to display as positive or negative
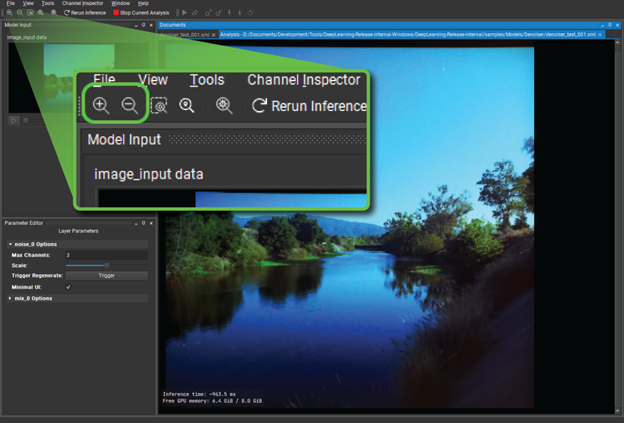
Have a look at the final output of the model and compare it with the original input. This is where the mix layer comes into play. Close down the channel inspector and look at the image output again. Use the Zoom button in the top left corner to make that output fill the user interface so that you can really see what is going on.
Figure 14. Two Zoom icons to make the output fill the Nsight DL Designer screen
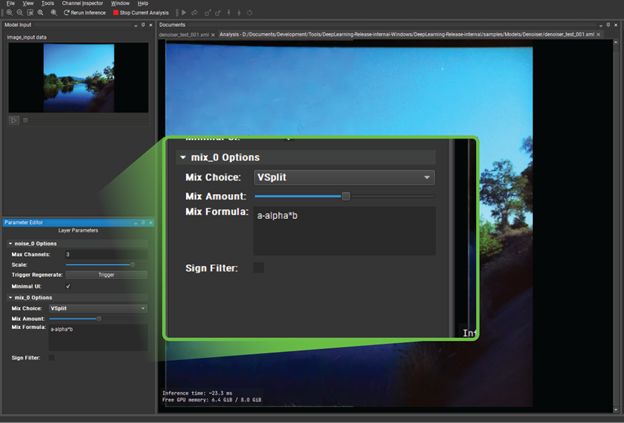
Under Mix Layer in the bottom left, change Mix Choice to V Split. When you drag the Mix Amount slider from left to right, you can see that you are actually getting a split screen between the original input and the reconstructed, denoised output. It is certainly useful, but the effect is quite subtle.
Figure 15. Using the Mix Layer option to create a split screen view
You could conclude that the denoiser is serving its purpose, but the differences are subtle. What can you do to get a clearer idea about which image parts are performing better than others?
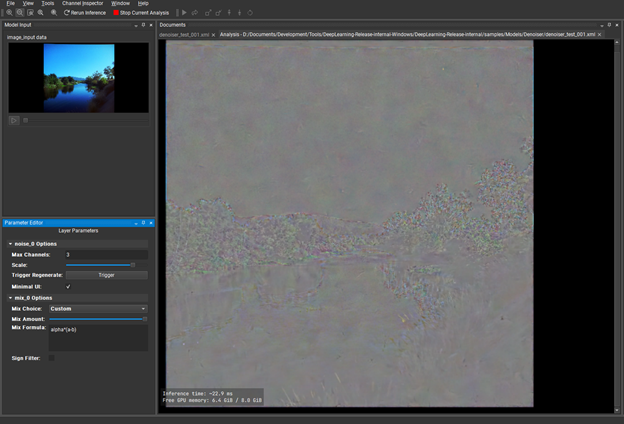
Under Mix Layer, change Mix Choice to Custom. For Mix Formula, replace the existing expression with: alpha * (a-b). The alpha keyword is effectively the normalized value of the slider and a and b are the two inputs of the layer. This creates a visual diff of the input and output that you can visually boost with the mix slider and tells you where there are fundamental differences between input and output.
This is the sort of thing that tells you, “Yes, your model is fine.” Or maybe, “You should revisit your architecture or training data.”
Figure 16. A visual diff of the input and output boosted by the Mix slider feature.
Conclusion
NVNsight DL Designer provides even more features, such as NvNeural, a highly optimized inference engine with an extensible plugin-based architecture that enables you to implement your own layer types.
Together with the design and analysis tools, DL Designer is a highly interactive and versatile solution to model design, reducing coding errors, and complexities to focus more on the capabilities and performance of your models.
For more information, see the following resources:

 Read a complete overview of the Nsight suite of developer tools with new features and capabilities.
  With Linux Switch on Spectrum, Yandex gained transparency and control over the network, and disaggregated networking hardware and software, and lowered costs.
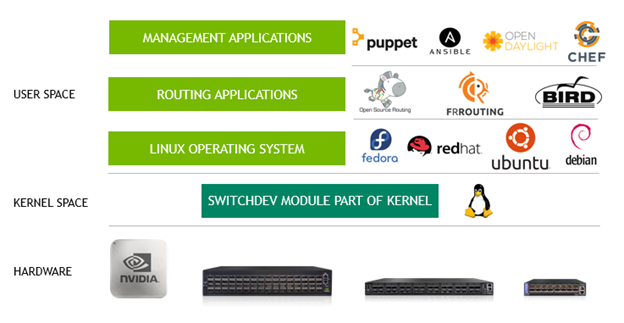
 Technical overview of the Nsight DL Designer tool to help ease the process of performant model design.