How to optimize DX12 resource uploads from the CPU to the GPU over the PCIe bus is an old problem with many possible solutions, each with their pros and cons. In this post, I show how moving cherry-picked DX12 UPLOAD heaps to CPU-Visible VRAM (CVV) using NVAPI can be a simple solution to speed up … Continued
How to optimize DX12 resource uploads from the CPU to the GPU over the PCIe bus is an old problem with many possible solutions, each with their pros and cons. In this post, I show how moving cherry-picked DX12 UPLOAD heaps to CPU-Visible VRAM (CVV) using NVAPI can be a simple solution to speed up PCIe limited workloads.
CPU-Visible VRAM: A new tool in the toolbox
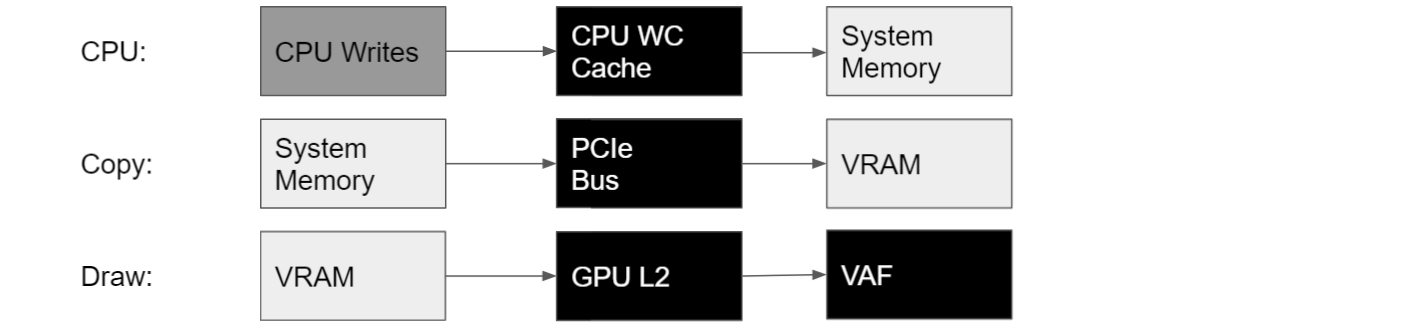
Take the example of a vertex buffer (VB) upload, for which the data cannot be reused across frames. The simplest way to upload a VB to the GPU is to read the CPU memory directly from the GPU:
First, the application creates a DX12 UPLOAD heap, or an equivalent CUSTOM heap. DX12 UPLOAD heaps are allocated in system memory, also known as CPU memory, with WRITE_COMBINE (WC) pages optimized for CPU writes. The CPU writes the VB data to this system memory heap first.
Second, the application binds the VB within the UPLOAD heap to a GPU draw command, by using an IASetVertexBuffers command.
When the draw executes in the GPU, vertex shaders are launched. Next, the vertex attribute fetch (VAF) unit reads the VB data through the GPU’s L2 cache, which itself loads the VB data from the DX12 UPLOAD heap stored in system memory:
Figure 1. Fetching a VB directly from a DX12 UPLOAD heap.
L2 accesses from system memory have high latency, so it is preferable to hide that latency by copying the data from system memory to VRAM before the draw command is executed.
The preupload from CPU to GPU can be done by using a copy command, either asynchronously by using a COPY queue, or synchronously on the main DIRECT queue.
Figure 2. Preloading a VB to VRAM using a copy command
Copy engines can execute copy commands in a COPY queue concurrently with other GPU work, and multiple COPY queues can be used concurrently. One problem with using async COPY queues though is that you must take care of synchronizing the queues with DX12 Fences, which may be complicated to implement and may have significant overhead.
In the The Next Level of Optimization Advice with Nsight Graphics: GPU Trace session at GTC 2021, we announced that an alternative solution for DX12 applications on NVIDIA GPUs is to effectively use a CPU thread as a copy engine. This can be achieved by creating the DX12 UPLOAD heap in CVV by using NVAPI. CPU writes to this special UPLOAD heap are then forwarded directly to VRAM, over the PCIe bus (Figure 3).
Figure 3. Preloading a VB to VRAM using CPU writes in a CPU thread
For DX12, the following NVAPI functions are available for querying the amount of CVV available in the system, and for allocating heaps of this new flavor (CPU-writable VRAM, with fast CPU writes and slow CPU reads):
NvAPI_D3D12_QueryCpuVisibleVidmem
NvAPI_D3D12_CreateCommittedResource
NvAPI_D3D12_CreateHeap2
These new functions require recent drivers: 466.11 or later.
NvAPI_D3D12_QueryCpuVisibleVidmem should report the following amount of CVV memory:
200-256 MB for NVIDIA RTX 20xx and 30xx GPUs with Windows 11 (for instance, with the Windows 11 Insider Preview).
Detecting and quantifying GPU performance-gain opportunities from CPU-Visible VRAM using Nsight Graphics
The GPU Trace tool within NVIDIA Nsight Graphics 2021.3 makes it easy to detect GPU performance-gain opportunities. When Advanced Mode is enabled, the Analysis panel within GPU Trace color codes perf markers within the frame based on the projected frame-reduction percentage by fixing a specific issue in this GPU workload.
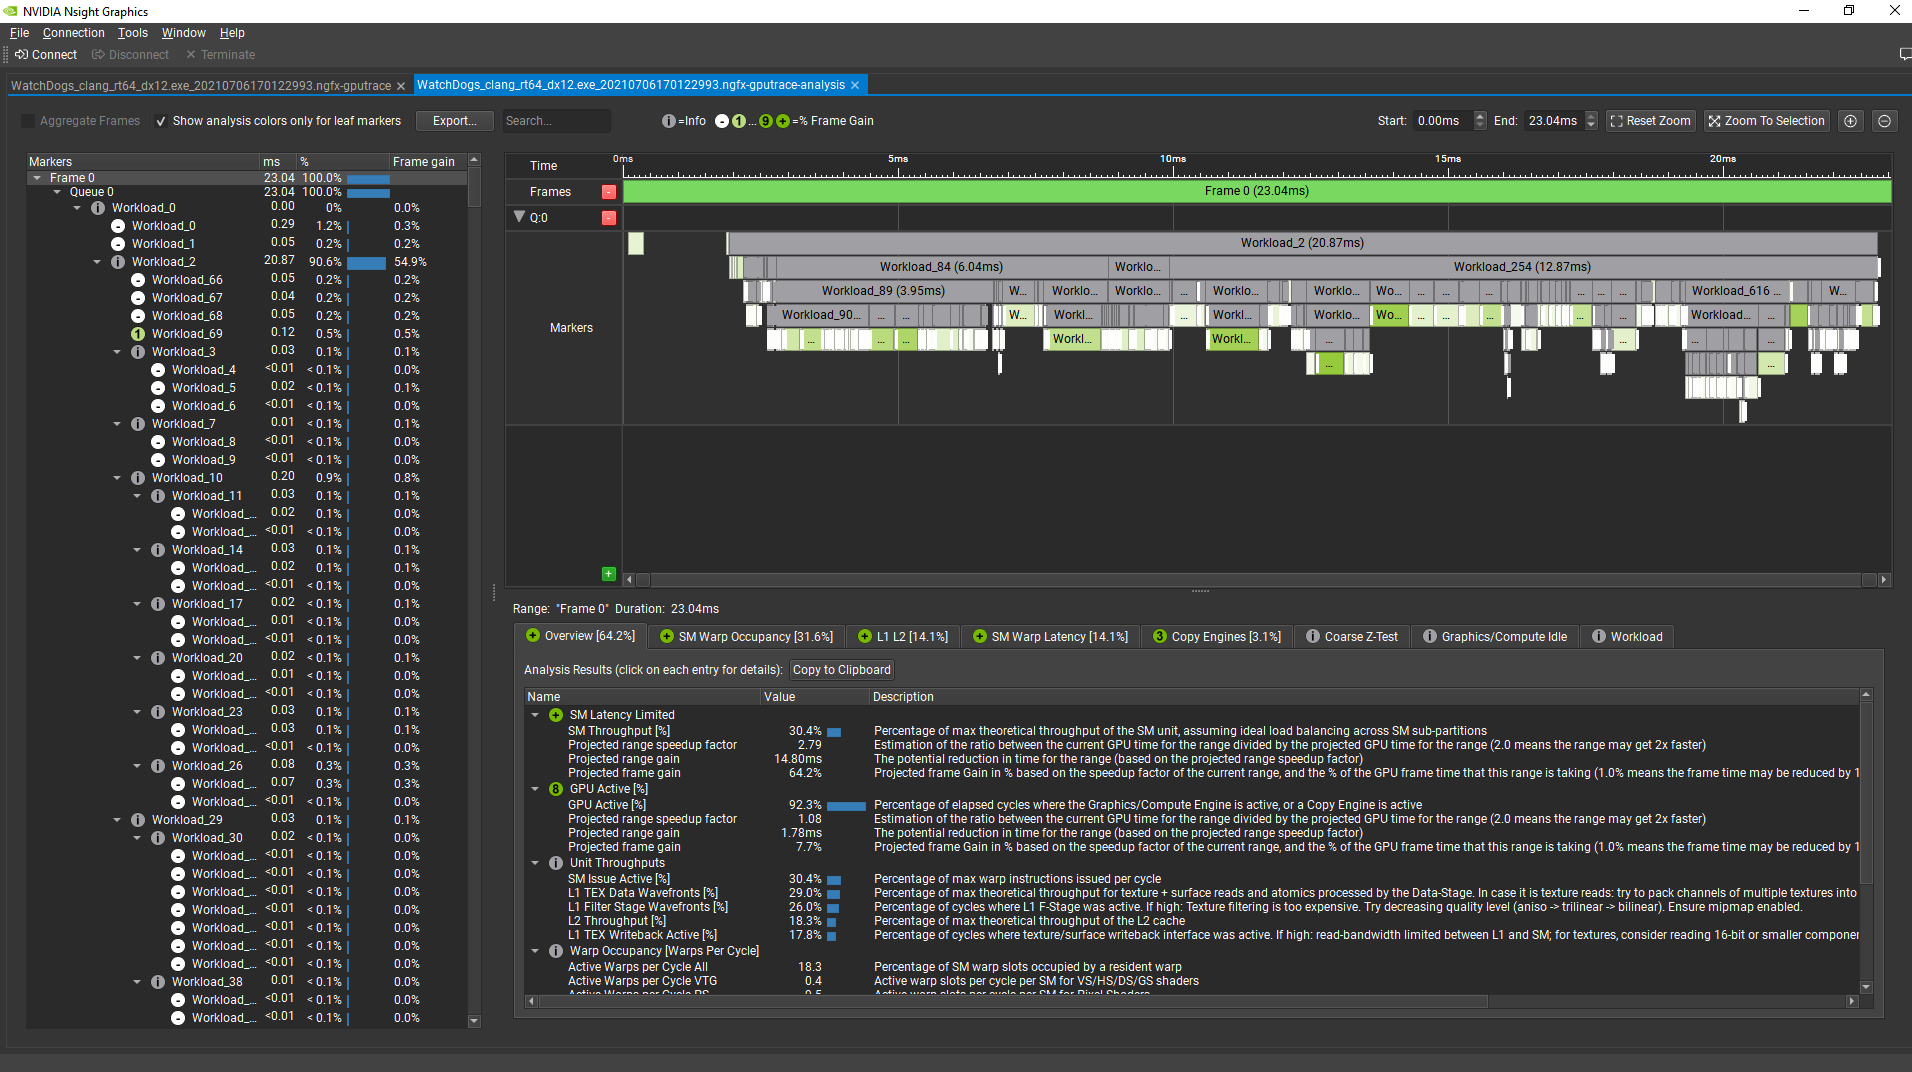
Here’s how it looks like for a frame from a prerelease build of Watch Dogs: Legion (DX12), on NVIDIA RTX 3080, after choosing Analyze:
Figure 4. The GPU Trace Analysis tool with color-coded GPU workloads (the greener, the higher the projected gain on the frame).
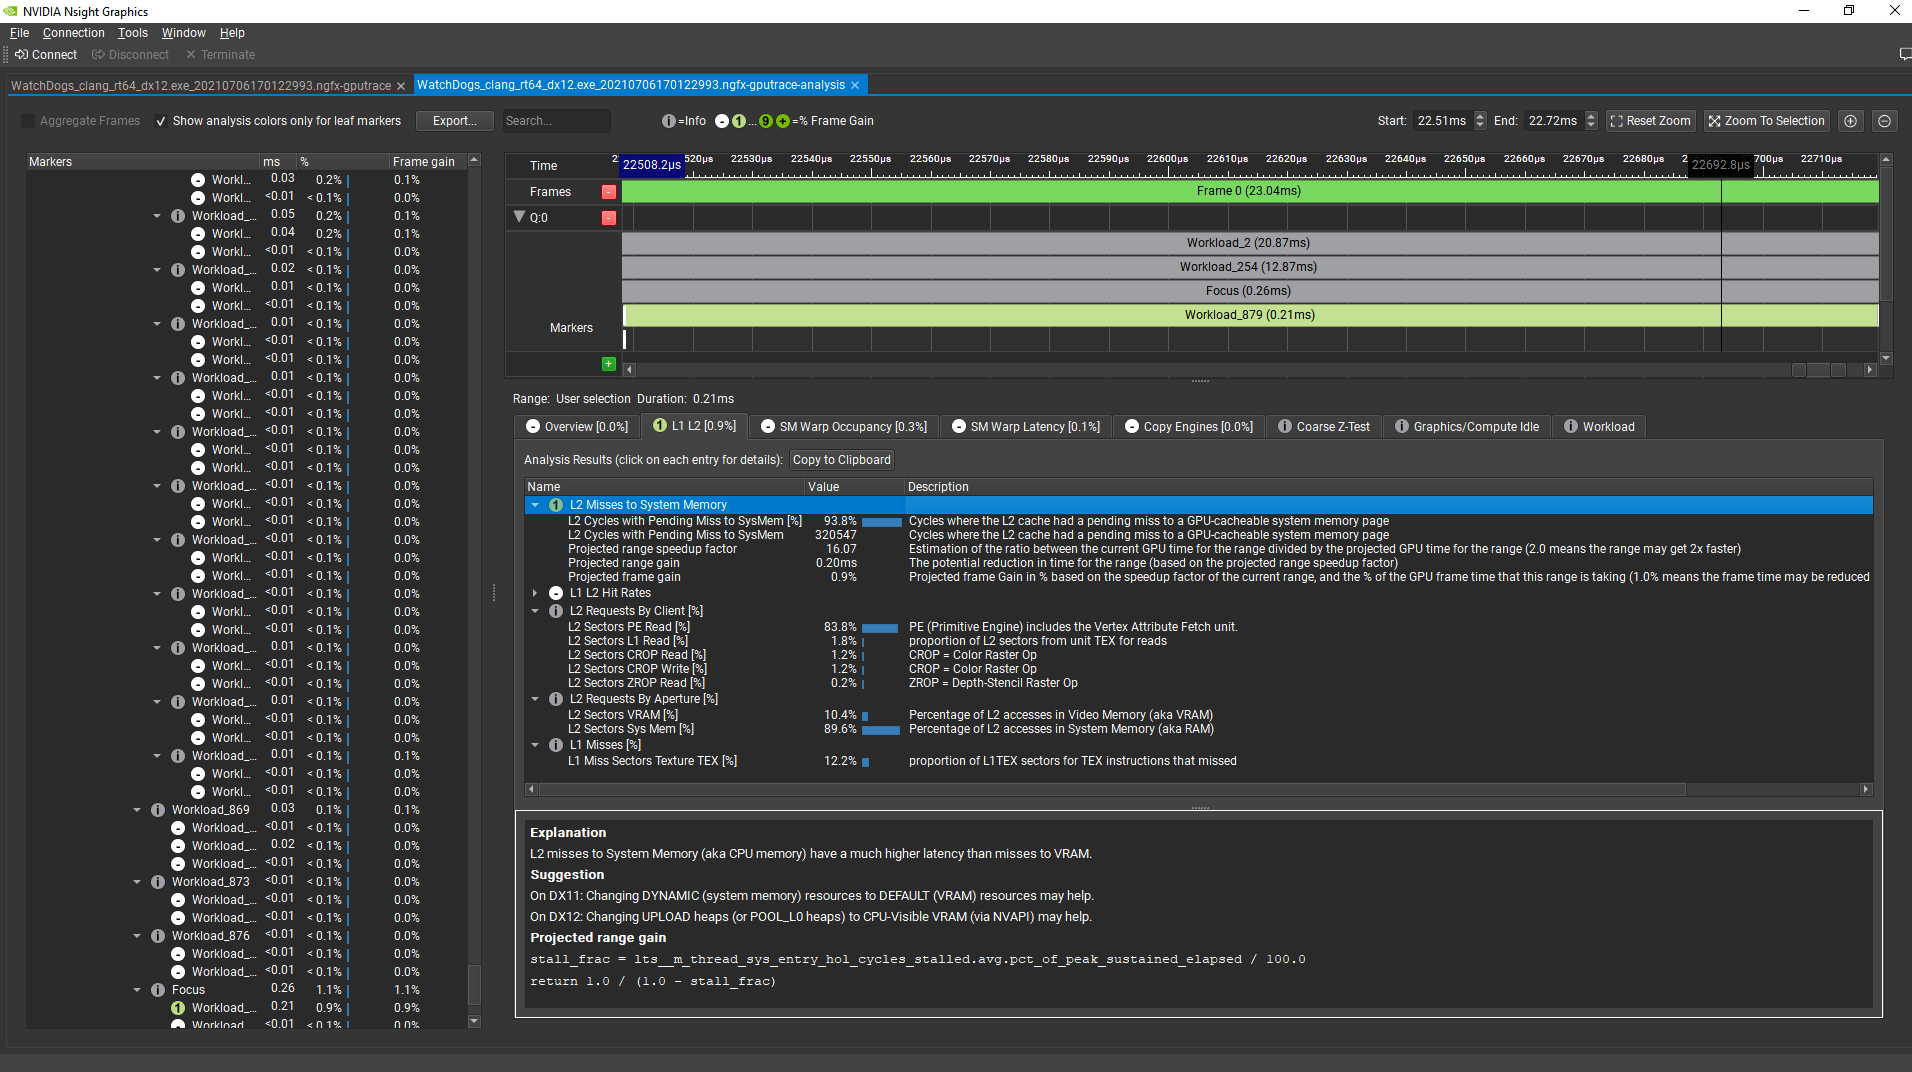
Now, selecting a user interface draw command at the end of the frame, the analysis tool shows that there is a 0.9% projected reduction in the GPU frame time from fixing the L2 Misses To System Memory performance issue. The tool also shows that most of the system memory traffic transiting through the L2 cache is requested by the Primitive Engine, which includes the vertex attribute fetch unit:
Figure 5. GPU Trace Analysis tool, focusing on a single workload.
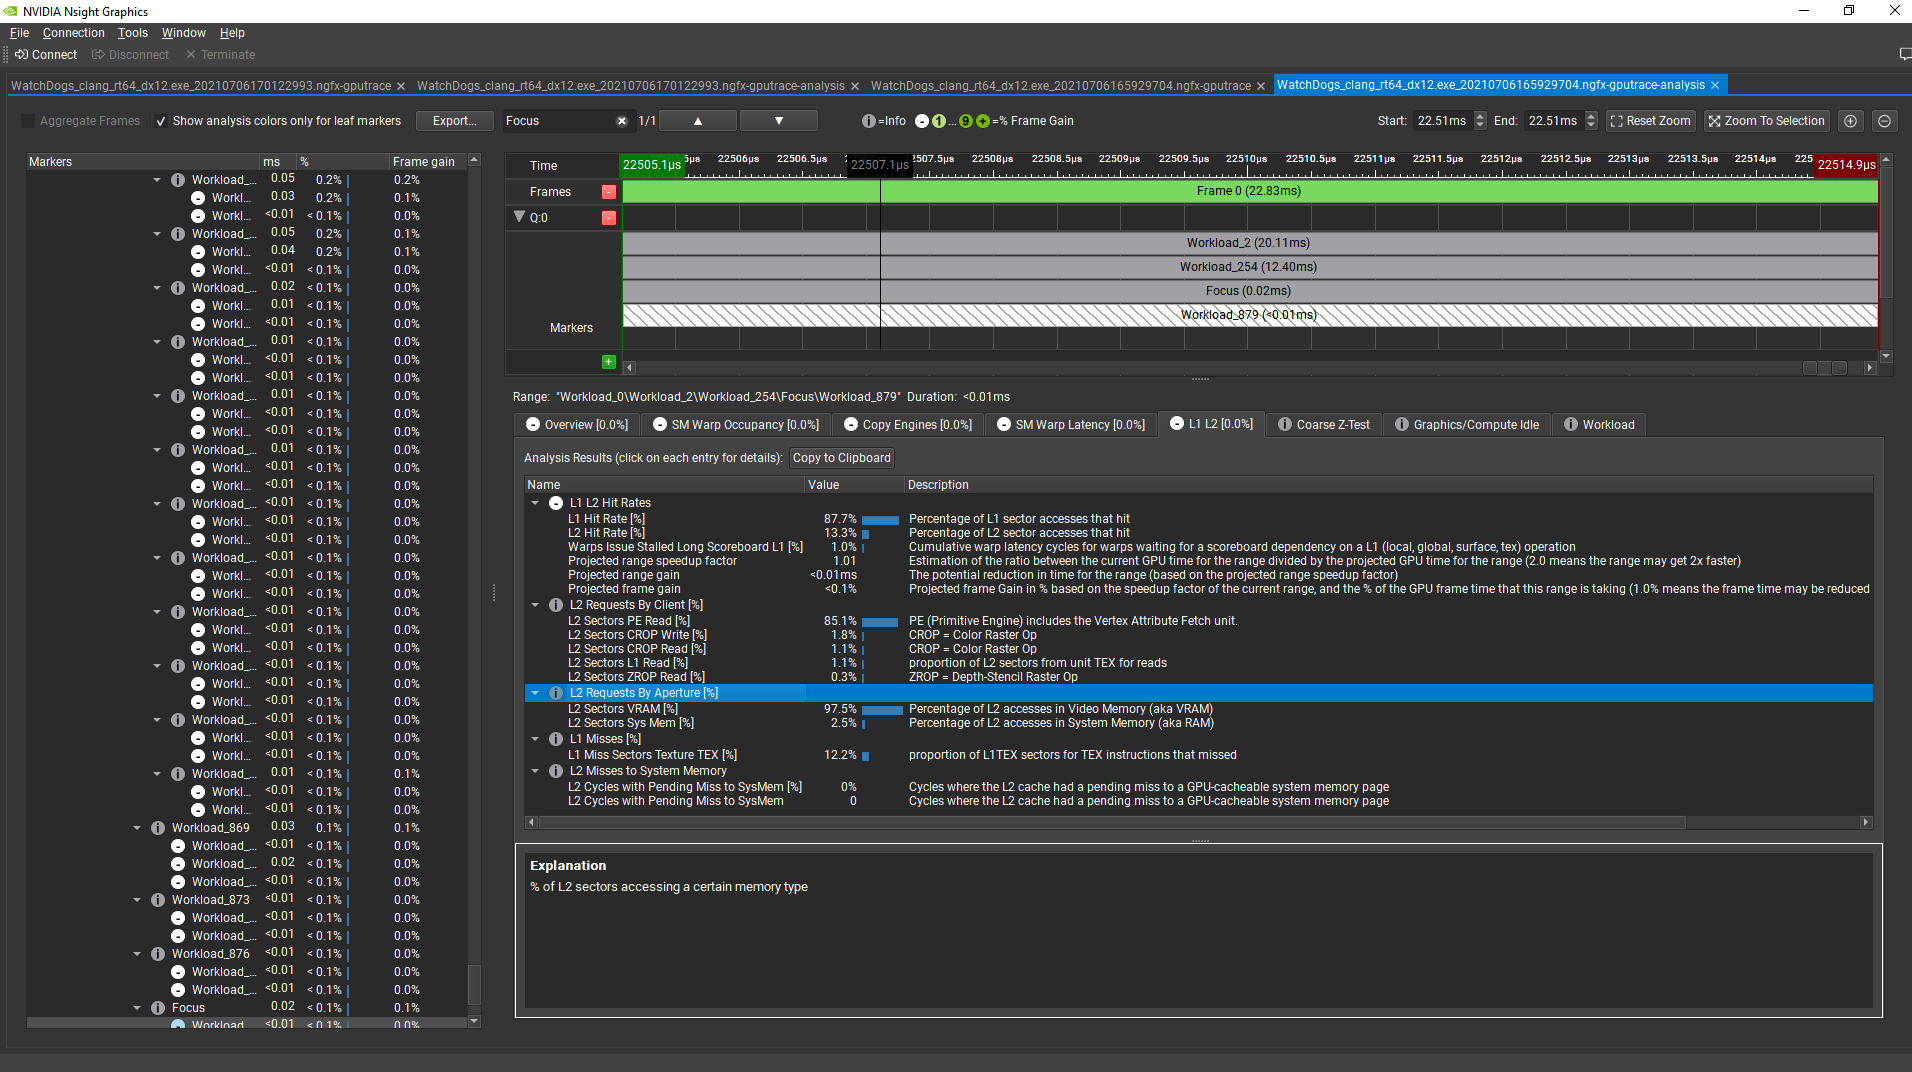
By allocating the VB of this draw command in CVV instead of system memory using a regular DX12 UPLOAD heap, the GPU time for this regime went from 0.2 ms to under 0.01 ms. The GPU frame time was also reduced by 0.9%. The VB data is now fetched directly from VRAM in this workload:
Figure 6. GPU Trace Analysis tool, after having optimized the workload.
Avoiding CPU reads from CPU-Visible VRAM using Nsight Systems
Regular DX12 UPLOAD heaps are not supposed to be read by the CPU but only written to. Like the regular heaps, CPU memory pages for CVV heaps have write combining enabled. That provides fast CPU write performance, but slow uncached CPU read performance. Moreover, because CPU reads from CVV make a round-trip through PCIe, GPU L2, and VRAM, the latencies of reads from CVV is much greater than the latency of reads from regular DX12 upload heaps.
To detect whether an application CPU performance is negatively impacted by CPU reads from CVV and to get information on what CPU calls are causing that, I recommend using Nsight Systems 2021.3.
Example 1: CVV CPU Reads through ReadFromSubresource
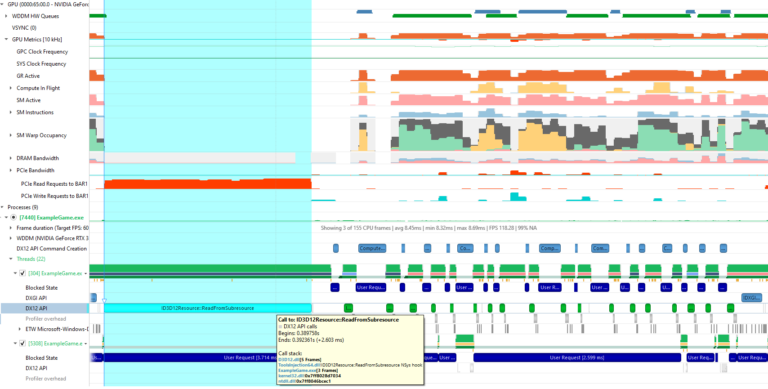
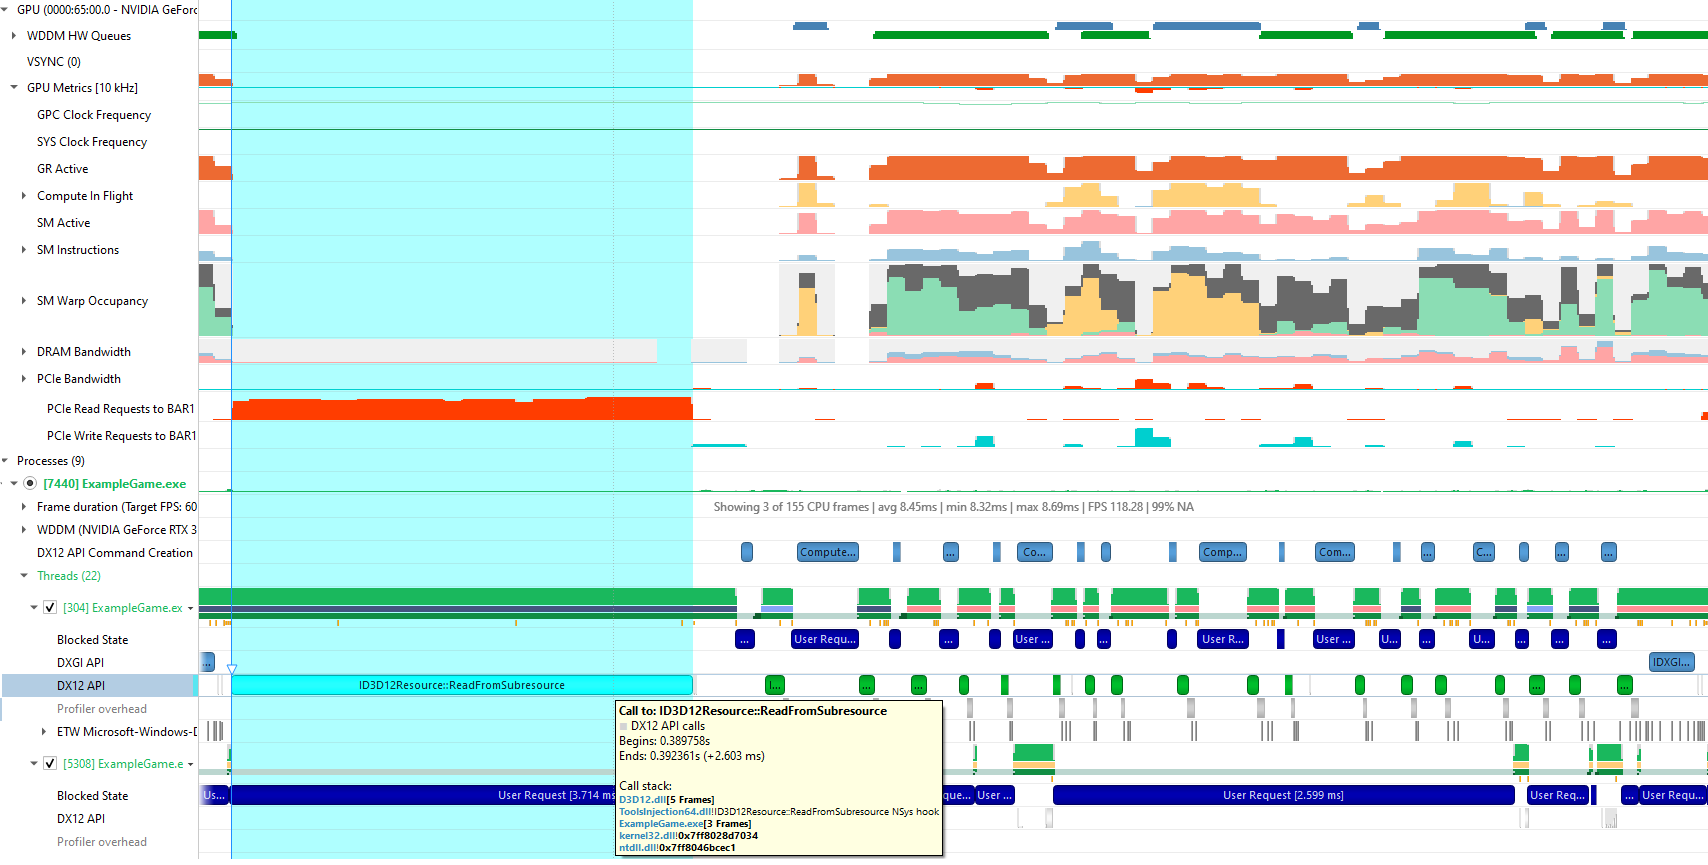
Here’s an example of a disastrous CPU read from a DX12 ReadFromSubresource, in a Nsight Systems trace. For capturing this trace, I enabled the new Collect GPU metrics option in the Nsight Systems project configuration when taking the trace, along with the default settings, which include Sample target process.
Here is what Nsight Systems shows after zooming in on one representative frame:
Figure 7. Nsight Systems showing a 2.6 ms ReadFromSubresource call in a CPU thread correlated with high PCIe Read Request Counts from BAR1.
In this case (a single-GPU machine), the PCIe Read Requests to BAR1 GPU metric in Nsight Systems measures the number of CPU read requests sent to PCIe for a resource allocated in CVV (BAR1 aperture). Nsight Systems shows a clear correlation between a long DX12 ReadFromSubresource call on a CPU thread and a high number of PCIe read requests from CVV. So you can conclude that this call is most likely doing a CPU readback from CVV, and fix that in the application.
Example 2: CVV CPU reads from a mapped pointer
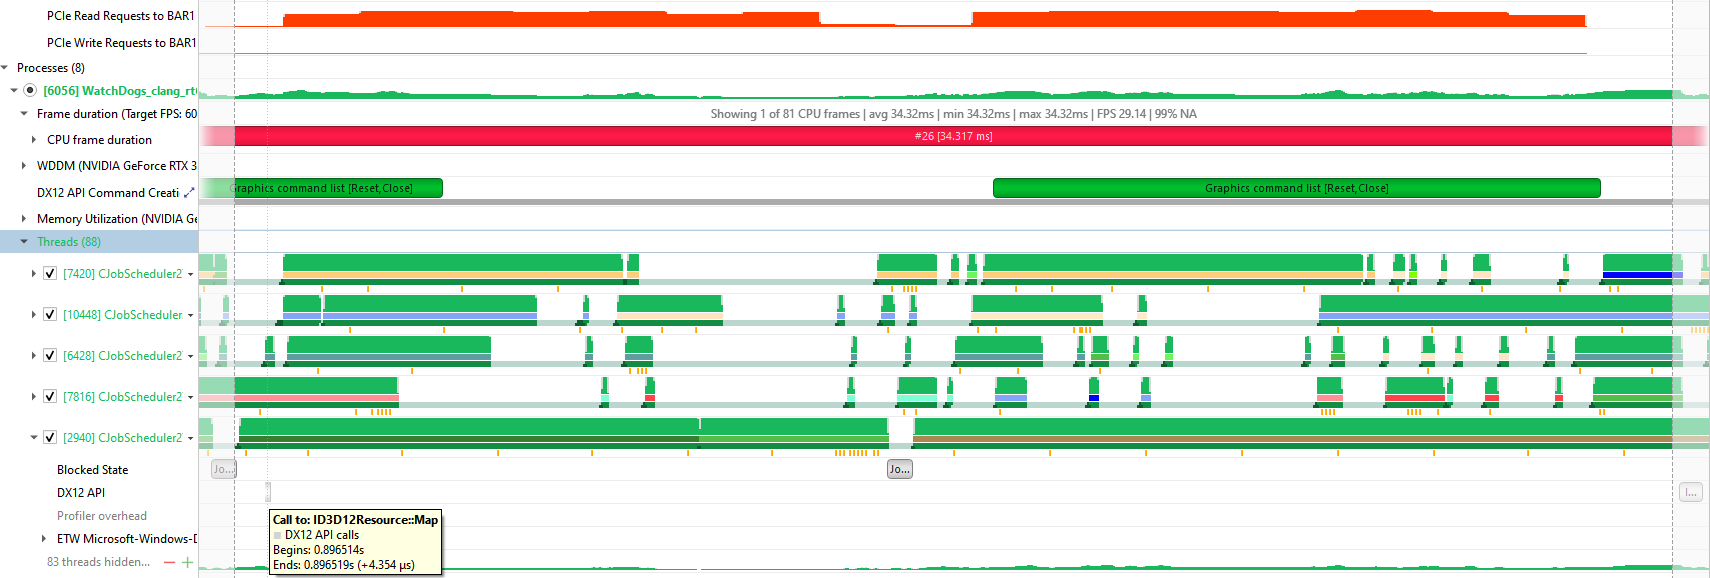
CPU reads from CVV are not limited to DX12 commands. They can happen in any CPU thread when using any CPU memory pointer returned by a DX12 resource Map call. That is why using Nsight Systems is recommended for debugging them, because Nsight Systems can periodically sample call stacks per CPU thread, in addition to selected GPU hardware metrics.
Here is an example of Nsight Systems showing CPU reads from CVV correlated with no DX12 API calls, but with the start of a CPU thread activity:
Figure 8. Nsight Systems showing correlation between a CPU thread doing a Map call and PCIe read requests to BAR1 increasing right after.
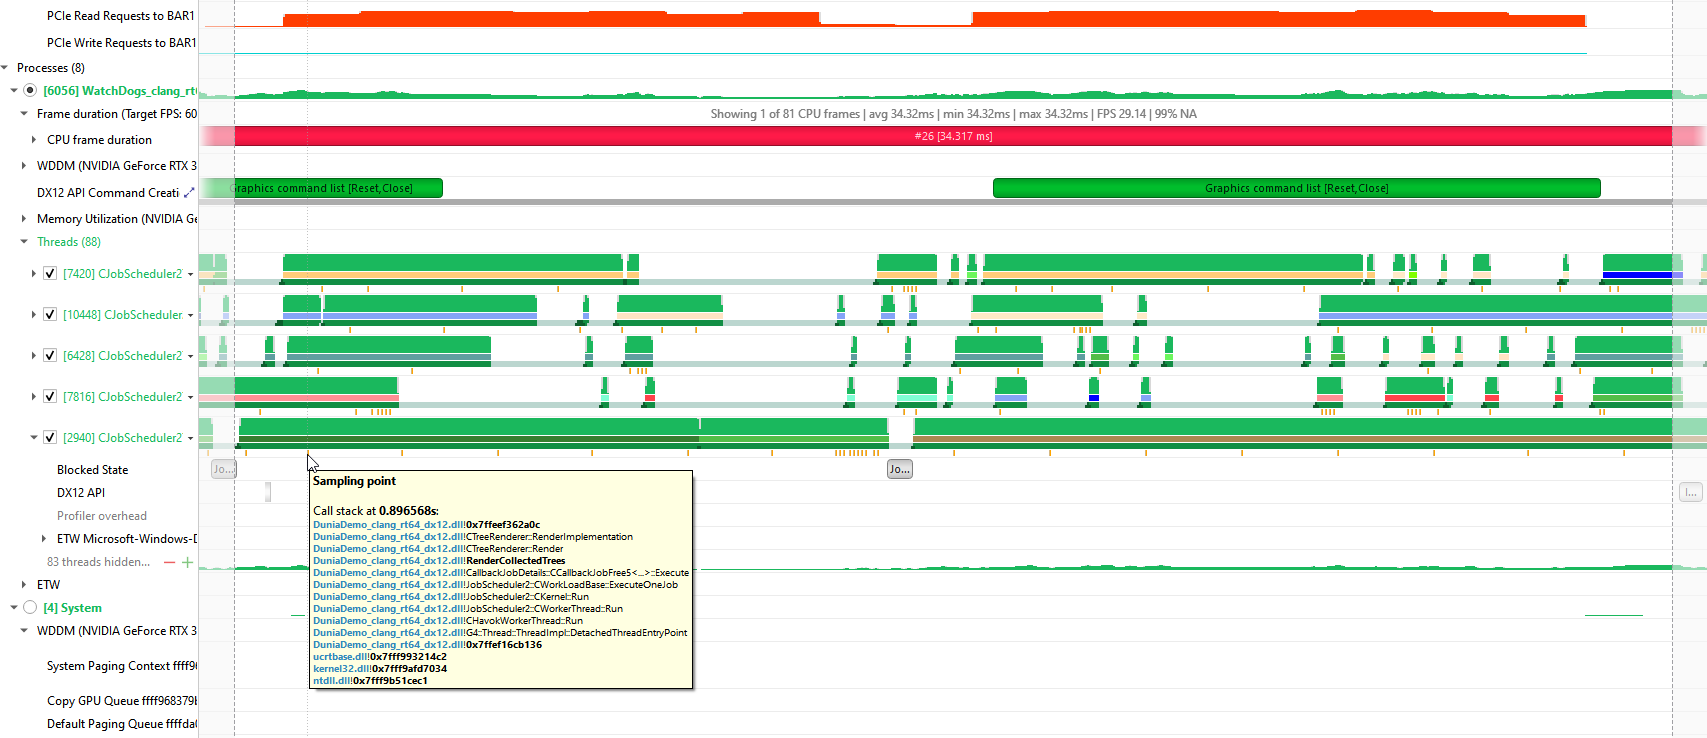
By hovering over the orange sample points right under the CPU thread, you see that this thread is executing a C++ method named RenderCollectedTrees, which can be helpful to locate the code that is doing read/write operations to the CVV heap:
Figure 9. Nsight Systems showing a call stack sample point for the CPU thread that is correlated to the high PCIe read requests to BAR1.
One way to improve the performance in this case would be to perform the read/write accesses to a separate chunk of CPU memory, not in a DX12 UPLOAD heap. When all read/write updates are finished, do a memcpy call from the CPU read/write memory to the UPLOAD heap.
Conclusion
All PC games running on Windows 11 PCs can use 256 MB of CVV on NVIDIA RTX 20xx and 30xx GPUs. NVAPI can be used to query the total amount of available CVV memory in the system and to allocate DX12 memory in this space. This makes it possible to replace DX12 UPLOAD heaps with CVV heaps by simply changing the code that allocates the heap, if the CPU never reads from the original DX12 UPLOAD heap.
To detect GPU performance-gain opportunities from moving a DX12 UPLOAD heap to CVV, I recommend using the GPU Trace Analysis tool, which is part of Nsight Graphics. To detect and debug CPU performance loss from reading from CVV, I recommend using Nsight Systems with its GPU metrics enabled.
Acknowledgments
I would like to acknowledge the following NVIDIA colleagues, who have contributed to this post: Avinash Baliga, Dana Elifaz, Daniel Horowitz, Patrick Neill, Chris Schultz, and Venkatesh Tammana.
The NGC team is hosting a webinar with live Q&A to dive into how to build AI models using PyTorch Lightening, an AI framework built on top of PyTorch, from the NGC catalog.
The NGC team is hosting a webinar with live Q&A to dive into how to build AI models using PyTorch Lightning, an AI framework built on top of PyTorch, from the NGC catalog.
Organizations across industries are using AI to help build better products, streamline operations, and increase customer satisfaction.
Today, speech recognition services are deployed in financial organizations to transcribe earnings calls, in hospitals to assist doctors writing patient notes, and in video broadcasting for live captioning.
Under the hood, researchers and data scientists are building hundreds of AI models to experiment and identify the most impactful models to deploy for their use cases.
PyTorch Lightning, an AI framework built on top of PyTorch, simplifies coding, so researchers can focus on building models and reduce time spent on the engineering process. It also speeds up the development of hundreds of models by easily scaling on GPUs within and across nodes.
By joining this webinar, you will learn:
About the benefit of using PyTorch Lightning and how it simplifies building complex models
How NGC helps accelerate AI development by simplifying software deployment
How researchers can quickly build models using PyTorch Lightning from NGC on AWS
Immersive 3D design and character creation are going sky high this week at SIGGRAPH, in a demo showcasing NVIDIA CloudXR running on Google Cloud. The clip shows an artist with an untethered VR headset creating a fully rigged character with Masterpiece Studio Pro, which is running remotely in Google Cloud and interactively streamed to the Read article >
With deep learning, amputees can now control their prosthetics by simply thinking through the motion. Jules Anh Tuan Nguyen spoke with NVIDIA AI Podcast host Noah Kravitz about his efforts to allow amputees to control their prosthetic limb — right down to the finger motions — with their minds. The AI Podcast · Jules Anh Read article >
NVIDIA CloudXR is coming to NVIDIA RTX Virtual Workstation instances on Google Cloud. Built on NVIDIA RTX GPUs, NVIDIA CloudXR enables streaming of immersive AR, VR, or mixed reality experiences from anywhere. Organizations can easily set up and scale immersive experiences from any location, to any VR or AR device. By streaming from Google Cloud, … Continued
NVIDIA CloudXR is coming to NVIDIA RTX Virtual Workstation instances on Google Cloud.
Built on NVIDIA RTX GPUs, NVIDIA CloudXR enables streaming of immersive AR, VR, or mixed reality experiences from anywhere. Organizations can easily set up and scale immersive experiences from any location, to any VR or AR device.
By streaming from Google Cloud, XR users can securely access data from the cloud at any time, and they can easily share the immersive experiences with other teams or customers.
NVIDIA is partnering with Masterpiece Studio to showcase state-of-the-art character animation in VR. With NVIDIA CloudXR, Masterpiece Studio customers around the world can stream and collaborate on character creation workflows in a VR environment.
And with NVIDIA CloudXR, creators anywhere in the world can access a high-powered NVIDIA RTX Virtual Workstation, provisioned and delivered by Google Cloud.
“Creators should have the freedom of working from anywhere, without needing to be physically tethered to a workstation to work on characters or 3D models in VR,” said Jonathan Gagne, CEO at Masterpiece Studio. “With NVIDIA CloudXR, our customers will be able to power their creative workflows in high-quality immersive environments, from any location, on any device.”
“NVIDIA CloudXR technology delivered via Google Cloud’s global private fiber optic network provides an optimized, high-quality user experience for remotely streamed VR experiences. This unique combination unlocks the ability to easily stream work from anywhere using NVIDIA RTX Virtual Workstation,” said Rob Martin, Chief Architect for Gaming at Google. “With NVIDIA CloudXR on Google Cloud, the future of VR workflows can be more collaborative, intuitive, and productive.”
Learn more about NVIDIA CloudXR on Google Cloud with this SIGGRAPH demo.
NVIDIA CloudXR Availability
With NVIDIA CloudXR running on GPU-powered virtual machine instances on Google Cloud, companies can provide XR creators and end users with high-quality virtual experiences from anywhere in the world. NVIDIA CloudXR on Google Cloud will be generally available later this year, with a private beta available soon.
The NVIDIA CloudXR platform includes:
NVIDIA CloudXR SDK, which supports all OpenVR apps and includes broad client support for phones, tablets and HMDs.
NVIDIA RTX Virtual Workstations to provide high-quality graphics at the fastest frame rates.
NVIDIA AI SDKs to accelerate performance and increase immersive presence.
Apply now for early access to the SDK, and sign up to get the latest news and updates on upcoming NVIDIA CloudXR releases, including the private beta.
How would one export a specific named checkpoint from the outputs/-directory? It seems running python tensorflow_models/research/object_detection/exporter_main_v2.py … only uses the latest checkpoin in the trained_checkpoint_dir directory.
Can I export the latest checkpoint and then manually replace it with my desired one, or does the exported do some extra processing after copying?
In a turducken of a demo, NVIDIA researchers stuffed four AI models into a serving of digital avatar technology for SIGGRAPH 2021’s Real-Time Live showcase — winning the Best in Show award. The showcase, one of the most anticipated events at the world’s largest computer graphics conference, held virtually this year, celebrates cutting-edge real-time projects Read article >
In June 2020, we released the first NVIDIA Display Driver that enabled GPU acceleration in the Windows Subsystem for Linux (WSL) 2 for Windows Insider Program (WIP) Preview users. At that time, it was still an early preview with a limited set of features. A year later, as we have steadily added new capabilities, we … Continued
In June 2020, we released the first NVIDIA Display Driver that enabled GPU acceleration in the Windows Subsystem for Linux (WSL) 2 for Windows Insider Program (WIP) Preview users. At that time, it was still an early preview with a limited set of features. A year later, as we have steadily added new capabilities, we have also been focusing on optimizing the CUDA driver to deliver top performance on WSL2.
WSL is a Windows 10 feature that enables you to run native Linux command-line tools directly on Windows, without requiring the complexity of a dual-boot environment. Internally, WSL is a containerized environment that is tightly integrated with the Microsoft Windows OS. WSL2 enables you to run Linux applications alongside traditional Windows desktop and modern store apps. For more information about CUDA on WSL, see Announcing CUDA on Windows Subsystem for Linux 2.
In this post, we focus on the current state of the CUDA performance on WSL2, the various performance-centric optimizations that have been made, and what to look forward to in the future.
Current state of WSL performance
Over the past several months, we have been tuning the performance of the CUDA Driver on WSL2 by analyzing and optimizing multiple critical driver paths, both on the NVIDIA and the Microsoft sides. In this post, we go into detail on what we have done exactly to reach the current performance level. Before we start that, here’s the current state of WSL2 on a couple of baseline benchmarks.
On WSL2, all the GPU operations are serialized through VMBUS and sent to the host kernel interface. One of the most common performance questions around WSL2 is the overhead of said operations. We understand that developers want to know whether there is any overhead to running workloads in WSL2 compared to running them directly on native Linux. Is there a difference? Is this overhead significant?
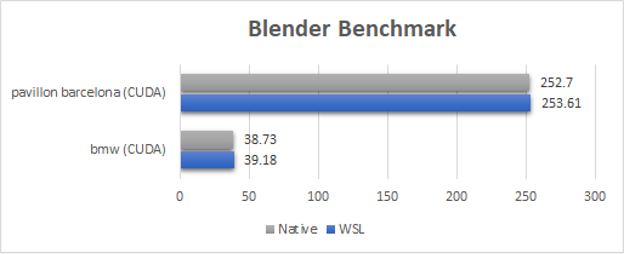
Figure 1. Blender benchmark results (WSL2 vs. Native, results in seconds, lower is better).
For the Blender benchmark, WSL2 performance is comparable or close to native Linux (within 1%). Because Blender Cycles push a long running kernel on the GPU, the overhead of WSL2 is not visible on any of those benchmarks.
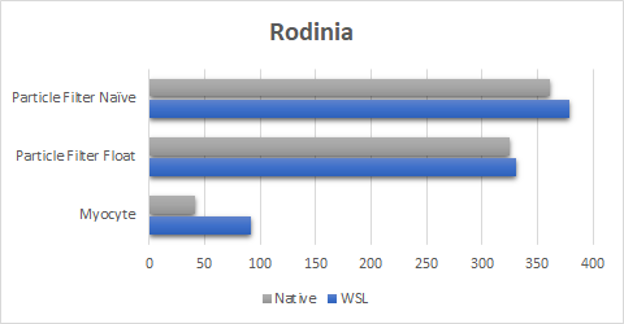
Figure 2. Rodinia benchmark suite results (WSL2 vs. Native, results in seconds, lower is better).
When it comes to the Rodinia Benchmark suite (Figure 2), we have come a long way from the performance we were able to achieve when we first launched support for WSL2.
The new driver can perform considerably better and can even reach close to native execution time for Particle Filter tests. It also finally closes the gap for the Myocyte benchmark. This is especially of consequence for the Myocyte benchmark where the early results with WSL2 were up to 10 times slower compared to native Linux. Myocyte is particularly hard on WSL2, as this benchmark consists of many extremely small sequential submissions (less than microseconds), making it a sequential launch latency microbenchmark. This is an area that we’re investigating to achieve complete performance parity.
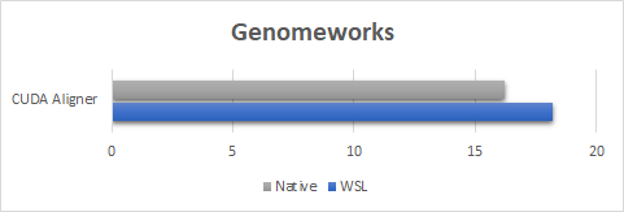
Figure 3. GenomeWorks CUDA Aligner sample execution time (WSL2 vs. Native, results in seconds, lower is better).
For the GenomeWorks benchmark (Figure 3), we are using CUDA aligner for GPU-Accelerated pairwise alignment. To show the worst-case scenario of performance overhead, the benchmark runs here were done with a sample dataset composed of short running kernels. Due to how short the kernel launches are, you can observe the launch latency overhead on WSL2. However, even for this worst-case example, the performance is equal to or more than 90% of the native speed. Our expectation is that for real-world use cases, where dataset sizes are typically larger, performance will be close to native performance.
To explore this key trade-off between kernel size and WSL2 performance, look at the next benchmark.
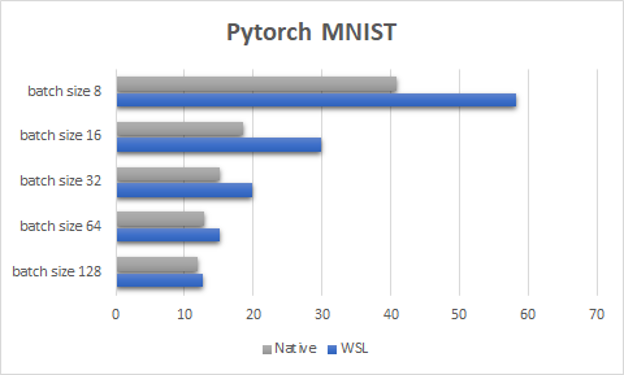
Figure 4. PyTorch MNIST sample time per epoch, with various batch sizes (WSL2 vs. Native, results in seconds, lower is better).
Figure 4 shows the PyTorch MNIST test, a purposefully small, toy machine learning sample that highlights how important it is to keep the GPU busy to reach satisfactory performance on WSL2. As with native Linux, the smaller the workload, the more likely that you’ll see performance degradation due to the overhead of launching a GPU process. This degradation is more pronounced on WSL2, and scales differently compared to native Linux.
As you keep improving the WSL2 driver, this difference in scaling for exceedingly small workloads should become less and less pronounced. The best way to avoid these pitfalls, both on WSL2 and on native Linux, is to keep the GPU busy as much as possible.
WSL2
Native Linux
OS
Latest Windows Insider Preview
Ubuntu 20.04
WSL Kernel Driver
5.10.16.3-microsoft-standard-WSL2
N/A
Driver Model
GPU Accelerated Hardware Scheduling
N/A
System
All benchmarks were run on the same system with an NVIDIA RTX 6000
All benchmarks were run on the same system with an NVIDIA RTX 6000
Table 1. System configuration and software releases used for benchmark testing.
Benchmark name
Description
Blender
Classic blender benchmark run with CUDA (not NVIDIA OptiX) on the BMW and Pavillion Barcelona scenes.
NVIDIA GenomeWork
CUDA pairwise alignment sample (available as a sample in the GenomeWork repository).
PyTorch MNIST
Modified (code added to time each epoch) MNIST sample.
Myocyte, Particle Filter
Benchmarks that are part of the RODINIA benchmark suite.
Table 2. Benchmark test names used with a brief description of each.
Launch latency optimizations
Launch latency is one of the leading causes of performance disparities between some native Linux applications and WSL2. There are two important metrics here:
GPU kernel launch latency: The time it takes to launch a kernel with a CUDA call and start execution by the GPU.
End-to-end overhead (launch latency plus synchronization overhead): The overall time it takes to launch a kernel with a CUDA call and wait for its completion on the CPU, excluding the kernel run time itself.
Launch latency is usually negligible when the workload pushed onto the GPU is significantly bigger than the latency itself. Thanks to CUDA primitives like streams and graphs, you can keep the GPU busy and can leverage the asynchronous nature of these APIs to overcome any latency issues. However, when the execution time of the workload sent to the GPU is close to the launch latency, then it quickly becomes a major performance bottleneck. The launch latency will act as a launch rate limiter, which causes kernel execution performance to plunge.
Launch latency on native Windows
Before diving into what makes launch latency a significant obstacle to overcome on WSL2, we explain the launch path of a CUDA kernel on native Windows. There are two different launch models implemented in the CUDA driver for Windows: one for packet scheduling and another for hardware-accelerated GPU scheduling.
Packet scheduling
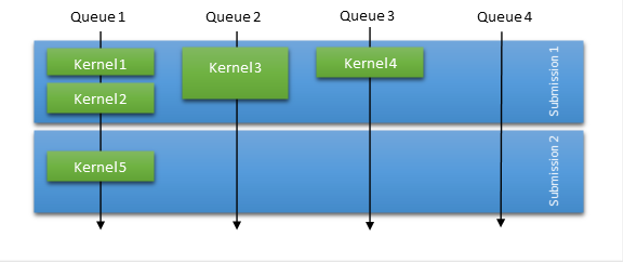
In packet scheduling, the OS is responsible for most of the scheduling work. However, to compensate for the submission model and the significant launch overhead, the CUDA driver always tries to batch a certain number of kernel launches based on various heuristics. Figure 5 shows that in packet scheduling mode, the OS schedules submissions and they are serialized for a given context. This means that all work of one submission must finish before any work of the next submission can start.
To improve the throughput in packet scheduling mode, the CUDA driver tries to aggregate some of the launches together in a single submission, even though internally they are dispatched across multiple GPU queues. This heuristic helps with false dependency and parallelism, and it also reduces the number of packets submitted, reducing scheduling overhead times.
Figure 5. Overview of the WDDM Packet Scheduling model and its use in the CUDA Driver.
In this submission model, you see performance reach its limits when the workload is launch latency bound. You can force outstanding submissions to be issued, by querying the status of a stream with a small pending workload. In this case, it still suffers from high scheduling overhead, on top of having to deal with potential false dependencies.
Hardware-accelerated GPU scheduling
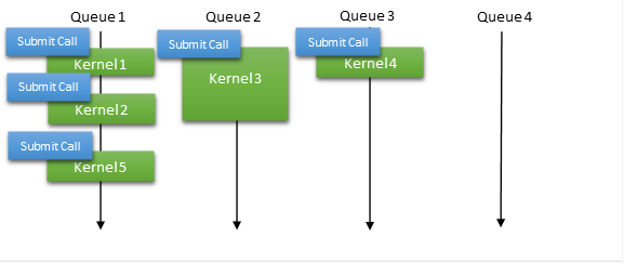
More recently, Microsoft introduced a new model called hardware-accelerated GPU scheduling. Using this model, hardware queues are directly exposed for a given context and the user mode driver (in this case, CUDA) is solely responsible for managing the work submissions and the dependencies between the work items. It removes the need for batching multiple kernel launches into a single submission, enabling you to adopt the same strategy as used in a native Linux driver where work submissions are almost instantaneous (Figure 6).
Figure 6. Overview of the WDDM Hardware Scheduling model and it is used in the CUDA Driver.
This hardware scheduling-based submission model removes the false dependency and avoids the need for buffering. It also reduces the overhead by offloading some of the OS scheduling tasks previously handled on the CPUs to the GPU.
Leveraging HW-accelerated GPU scheduling on WSL2
Why do these scheduling details matter? Native Windows applications were traditionally designed to hide the higher latency. However, launch latency was never a factor for native Linux applications, where the threshold at which latency affects performance was an order of magnitude smaller than the one on Windows.
When these same Linux applications run in WSL2, the launch latency becomes more prominent. Here, the benefits of hardware-accelerated GPU scheduling can offset the latency-induced performance loss, as CUDA adopts the same submission strategy followed on native Linux for both WSL2 and native Windows. We strongly recommend switching to hardware-accelerated GPU scheduling mode when running WSL2.
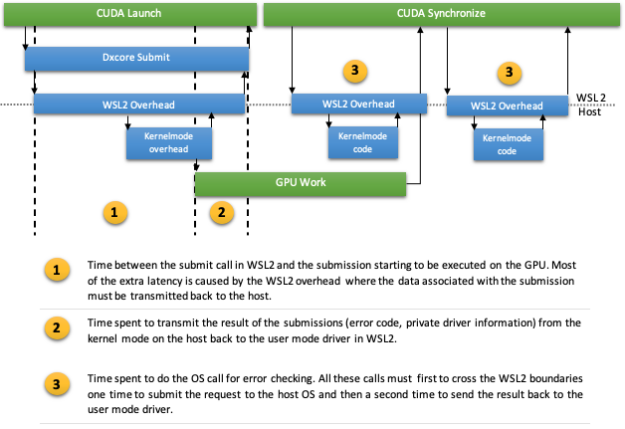
Even with hardware-accelerated GPU scheduling, submitting work to the GPU is still done with a call to the OS, just like in packet scheduling. Not only submission but, in some cases, synchronization might also have to make some OS calls for error detection. Each such call to the OS on WSL2 involves crossing the WSL2 boundary to reach the host kernel mode through VMBUS. This can quickly become the single bottleneck for the driver (Figure 7). Linux applications that are doing small batches of GPU work at a time may still not perform well.
Figure 7. Overview of the submission path on WSL2 and the various locations of the extra overhead.
Asynchronous submissions to reduce the launch latency
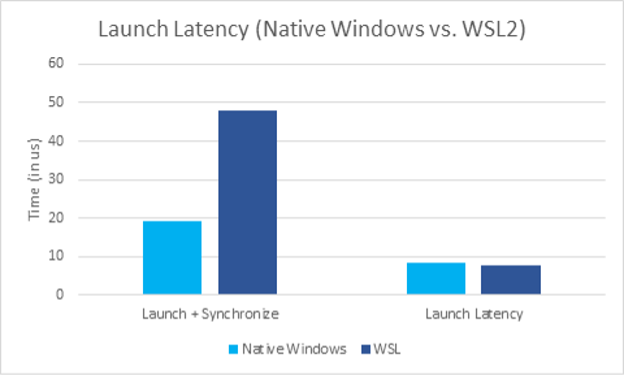
We found a solution to mitigate the extra launch latency on WSL through a change made by Microsoft to make the Submit call asynchronous. By leveraging this call, you can start overlapping other operations while the submission is happening and hide the extra WSL overhead in this way. Thanks to the new asynchronous nature of the submit call, the launch latency is now comparable to native Windows.
Figure 8. Microbenchmark of the launch latency on WSL2 and Native Windows.
Despite the optimization made in the synchronization path, the total overhead of launching and synchronizing on a submission is still higher compared to native Windows. The VMBUS overhead at point 1 causes this, not the synchronization path itself (Figure 7). This effect can be seen in Figure 8, where we measure the overhead of a single launch, followed by synchronization. The extra latency induced by VMBUS is clearly visible.
Making the submission call asynchronous does not necessarily remove the launch latency cost altogether. Instead, it enables you to offset it by doing other operations at the same time. An application can pipeline multiple launches on a stream for instance, assuming that the kernel launches are long enough to cover the extra latency. In that case, this cost can be shadowed and designed to be visible only at the beginning of a long series of submissions.
In short, we have and will continue to improve and optimize performance on WSL2. Despite all the optimizations mentioned thus far, if applications are not pipelining enough workload on the GPU, or worse, if the workload is too small, a performance gap between native Linux and WSL2 will start to appear. This is also why comparisons between WSL2 and native Linux are challenging and vary widely from benchmark to benchmark.
Imagine that the application is pipelining enough work to shadow the latency overhead and keep the GPU busy during the entire lifetime of the application. With the current set of optimizations, chances are that the performance will be close to or even comparable with native Linux applications.
When the GPU workload submitted by an application is not long enough to overcome that latency, a performance gap between native Linux and WSL2 will start to appear. The gap is proportional to the difference between the overall latency and the size of the work pushed at one time.
This is also why, despite all the improvements made in this area, we will keep focusing on reducing this latency to bring it closer and closer to native Linux.
New allocation optimization
Another area of focus for us has been memory allocation. Unlike launch latency, which affects the performance for as long as the application is launching work on the GPU, memory allocations mostly affect the startup and loading and unloading phases of a program.
This does not mean that it is unimportant; far from it. Even if those operations are infrequent compared to just submitting work on the GPU, the associated driver overhead is usually an order of magnitude higher. The allocation of several megabytes at a time end up taking several milliseconds to complete.
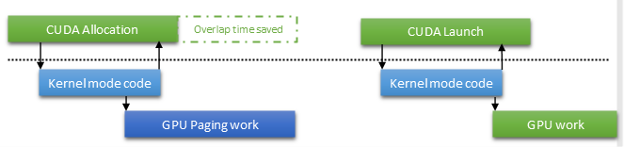
To optimize this path, one of our main approaches has been to enable asynchronous paging operation in CUDA. This capability has been available in the Windows Display Driver model for a while, but the CUDA driver never used it, until now. The main advantage of this strategy is that you can exit the allocation call and give control back to the user code. You don’t have to wait for an expensive GPU operation to complete, for example, updating the page table. Instead, the wait is postponed to the next operation that references the allocation.
Not only does this improve the overlap between the CPU and GPU work, but it can also eliminate the wait altogether. If the paging operation completes early enough, the CUDA driver can avoid issuing an OS call to wait on the paging operation by snooping a mapped fence value. On WSL2, this is particularly important. Anytime that you avoid calling into the host kernel mode, you also avoid the VMBUS overhead.
Figure 9. Overview of the asynchronous mapping of allocation done in the CUDA Driver.
Are we there yet?
We have come a long way when it comes to WSL2 performance over the past months, and we are now seeing results comparable or close to native Linux for many benchmarks. This doesn’t mean that we have reached our goal and that we will stop optimizing the driver. Not at all!
First, future optimization in hardware scheduling, currently being looked at by Microsoft, might allow us to bring the launch overhead to a minimum. In the meantime, until those features are fully developed, we will keep optimizing the CUDA driver on WSL, with recommendations for native Windows as well.
Second, we will focus on fast and efficient memory allocation through some special form of memory copy. We will also soon start looking at better multi-GPU features and optimizations on WSL2 to enable even more intensive workload to run fast.
WSL2 is a fully supported platform for NVIDIA, and it will be given the same feature offerings and performance focus that CUDA strives for all its other supported platforms. It is our intent to make WSL2 performance better and suitable for development. We will also make this into a CUDA platform that is attractive for every use case, with performance as close as possible to any native Linux system.
Last, but not least, we heartily thank the developer community that has been rapidly adopting GPU acceleration in the WSL2 preview, reporting issues, and providing feedback continuously over the past year. You have helped us uncover potential issues and make big strides on performance by sharing with us performance use cases that we might have missed otherwise. Without your unwavering support, GPU acceleration on WSL2 would not be where it is today. We look forward to engaging with the community further as we work on achieving future milestones for CUDA on WSL2.
The following resources contain valuable information to aid you on how CUDA works with WSL2, including how to get started with running applications, and deep learning containers:

 How to optimize DX12 resource uploads from the CPU to the GPU over the PCIe bus is an old problem with many possible solutions, each with their pros and cons. In this post, I show how moving cherry-picked DX12 UPLOAD heaps to CPU-Visible VRAM (CVV) using NVAPI can be a simple solution to speed up … Continued

 The NGC team is hosting a webinar with live Q&A to dive into how to build AI models using PyTorch Lightening, an AI framework built on top of PyTorch, from the NGC catalog.
 NVIDIA CloudXR is coming to NVIDIA RTX Virtual Workstation instances on Google Cloud. Built on NVIDIA RTX GPUs, NVIDIA CloudXR enables streaming of immersive AR, VR, or mixed reality experiences from anywhere. Organizations can easily set up and scale immersive experiences from any location, to any VR or AR device. By streaming from Google Cloud, …
  In June 2020, we released the first NVIDIA Display Driver that enabled GPU acceleration in the Windows Subsystem for Linux (WSL) 2 for Windows Insider Program (WIP) Preview users. At that time, it was still an early preview with a limited set of features. A year later, as we have steadily added new capabilities, we …