Gamers know NVIDIA powers great gaming experiences. Researchers know NVIDIA speeds world-changing breakthroughs. Businesses know us for the AI engines transforming their industries. And NVIDIA employees know the company as one of the best places to work on the planet. More people than ever have a piece of NVIDIA. Roboticists, visual artists, data scientists — Read article >
Monitor DPUs, validate RoCE deployments, gain network insights through flow-based telemetry analysis, and centrally view network events with NetQ 4.2.0.
NVIDIA NetQ is a highly scalable, modern networking operations tool providing actionable visibility for the NVIDIA Spectrum Ethernet platform. It combines advanced telemetry with a user interface, making it easier to troubleshoot and automate network workflows while reducing maintenance and downtime.
We have recently released NetQ 4.2.0, which includes:
With NetQ 4.2, we have simplified the way network events are communicated through the interface. Events vary in terms of severity—some events are network alarms that may require further investigation, while others are informational notices that may not require intervention. Before this release, NetQ displayed alarms and information events as two separate cards. The NetQ 4.2 release merges the two cards into a single card that, when expanded, displays a dashboard to help you quickly visualize all network events.
Figure 1. NetQ events dashboard
The dashboard presents a timeline of events alongside the switches that are causing the most events. You can filter events by type, including interface, network services, system, and threshold-crossing events.
Acknowledging events helps you focus on active events that need your attention. From the dashboard, you can also create rules to suppress events. This feature is also designed to help you focus on active events, so that known issues or false alarms are not displayed in the same way that errors are displayed.
Enhanced flow telemetry analysis
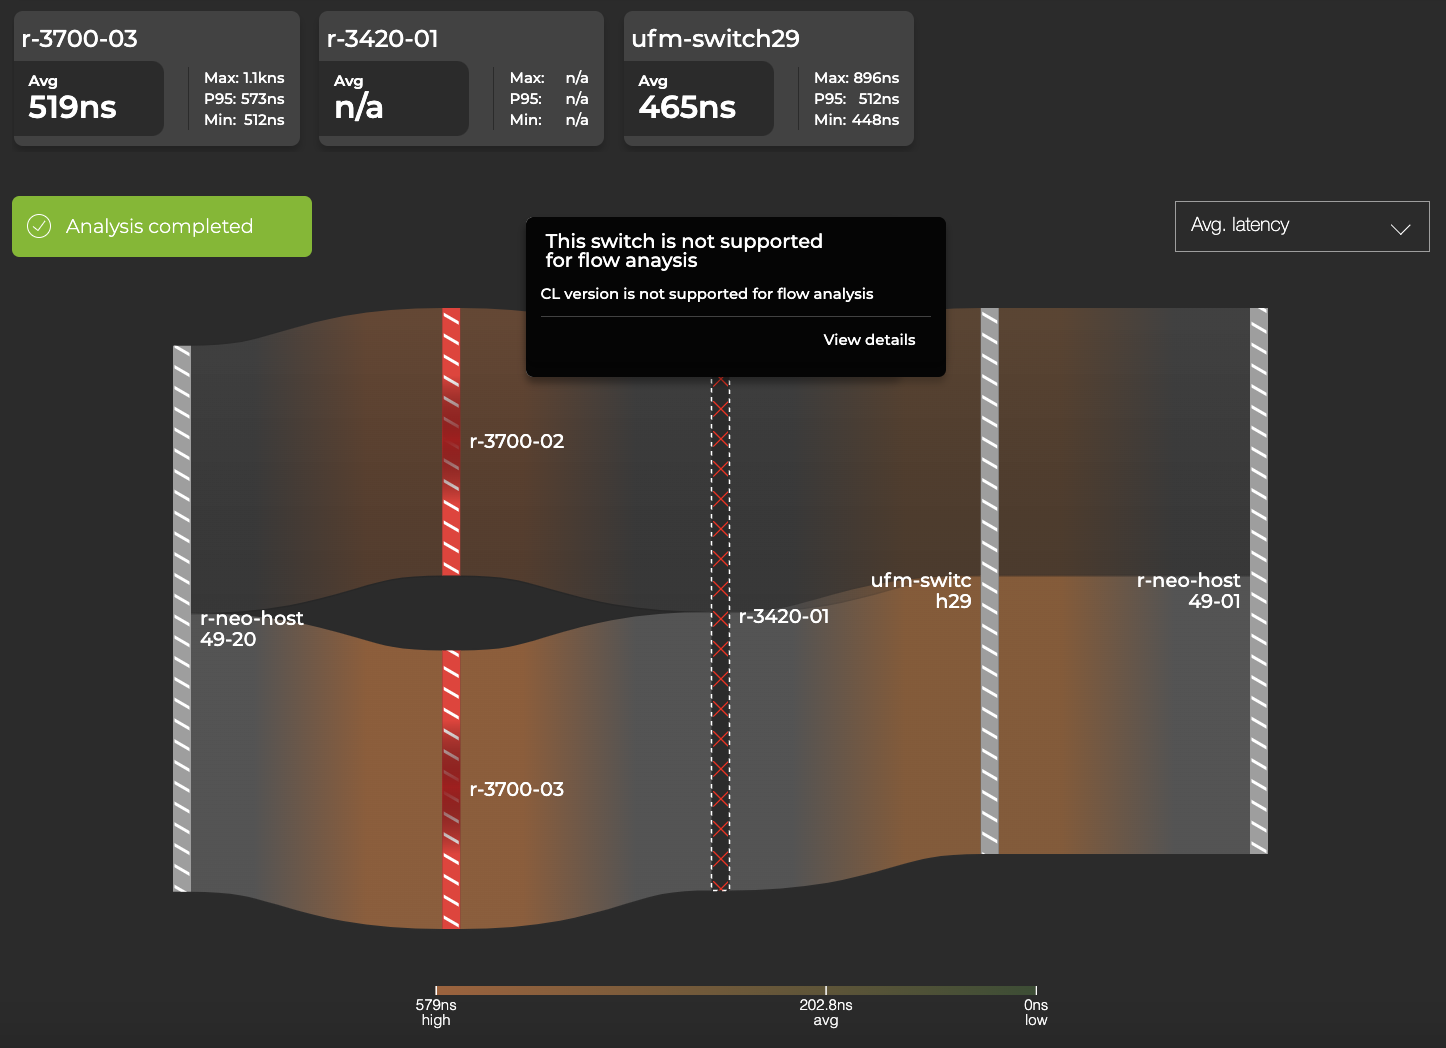
NetQ 4.1.0 introduced fabric-wide network latency and buffer occupancy analysis for Cumulus Linux 5.x data center fabrics. Now, NetQ 4.2 supports partial-path flow telemetry analysis in mixed fabrics—those that use Cumulus Linux 5.x switches in combination with other switches (including non-Cumulus Linux 5.x and third-party switches). Cumulus Linux 5.x devices in the path display flow statistics, such as latency and buffer occupancy. Unsupported devices are represented in the flow analysis as a black bar with a red X, and the device does not display flow statistics.
Figure 2. NetQ flow telemetry analysis results
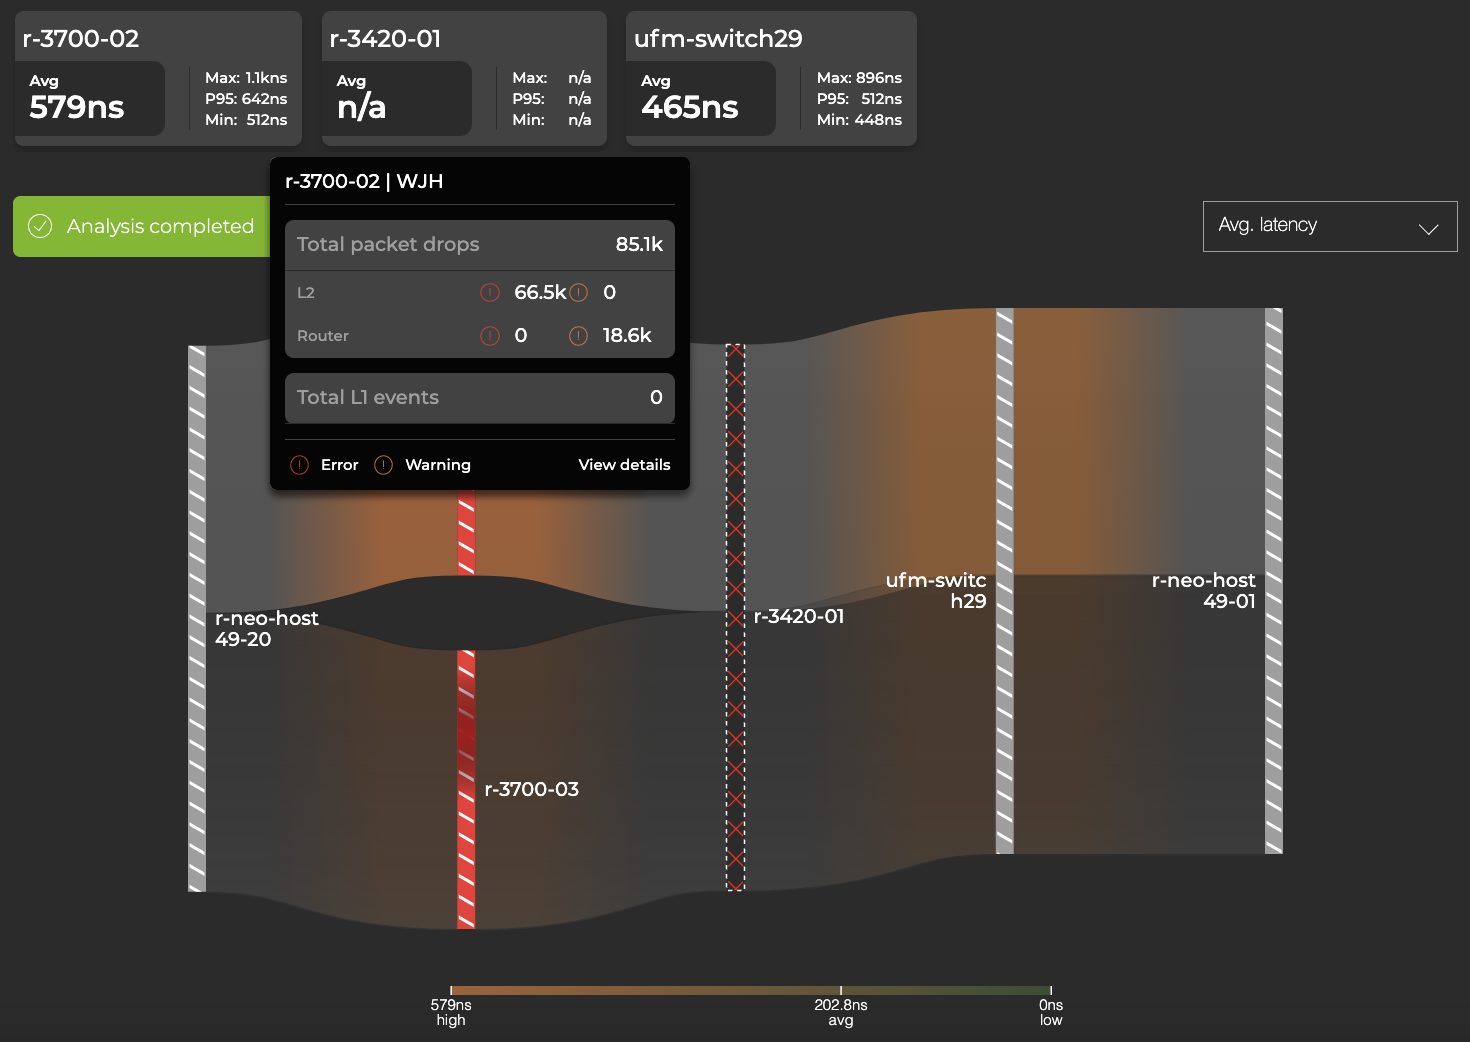
In addition, NetQ 4.2 flow telemetry analysis shows contextual ‘What Just Happened’ (WJH) events and drops for the flow under analysis. Switches with WJH events are represented in the flow analysis graph as a red, striped bar. Hovering over the device with the red bar presents a WJH events summary.
Figure 3. NetQ flow telemetry analysis with WJH data
New RoCE validation
With RDMA over Converged Ethernet (RoCE), you can write to compute or storage elements using remote direct memory access (RDMA) over an Ethernet network instead of using host CPUs. NetQ 4.0.0 introduced RoCE configuration and counters, including the ability to set up various RoCE threshold-crossing alerts (TCAs).
With NetQ 4.2.0, RoCE validation checks:
Lossy- or lossless-mode configuration consistency across switches
Consistency of DSCP, service pool, port group, and traffic class settings
Consistency of ECN threshold settings
Consistency of PFC configuration for lossless mode
Consistency of Enhanced Transmission Selection settings
You can schedule RoCE validation to run periodically or on-demand.
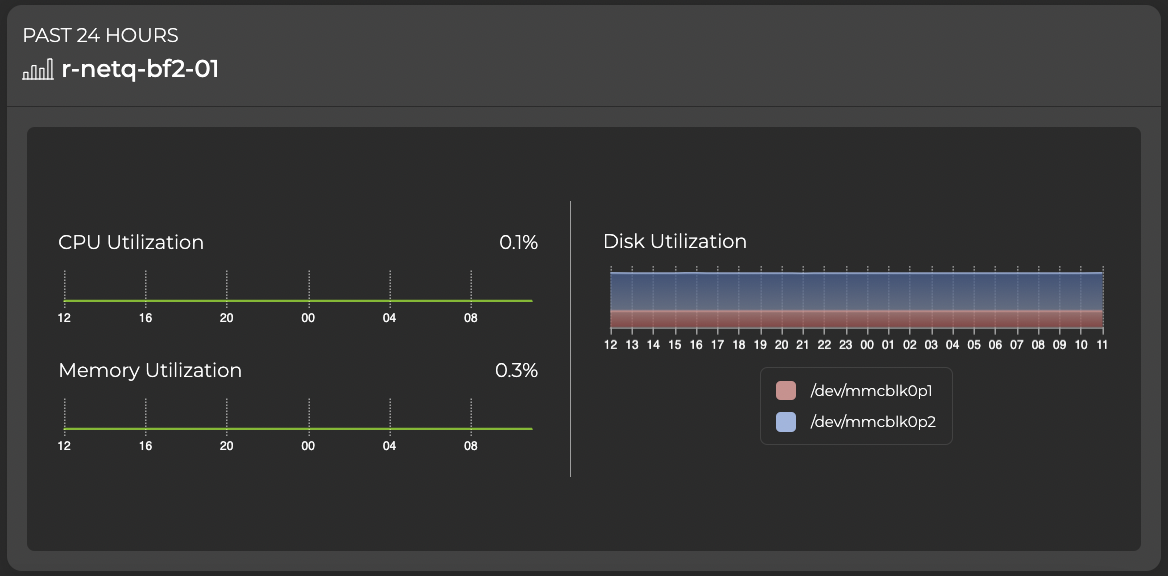
New DPU monitoring
NVIDIA BlueField data processing units (DPUs) provide a secure and accelerated infrastructure for any workload by offloading, accelerating, and isolating a broad range of advanced networking, storage, and security services.
NetQ helps you monitor your DPU inventory across the network. You can monitor a DPU OS, ASIC, CPU model, disk, and memory information to help manage upgrades, compliance, and other planning tasks. With NetQ, you can view and monitor key DPU attributes, including installed packages and CPU, disk, and memory utilization.
Figure 4. NetQ-DPU utilization details
In this post, you have seen an overview of some of the new capabilities available with NetQ 4.2.0. For more information, see the NetQ 4.2.0 User’s Guide and explore NetQ with NVIDIA Air.
I only need the tensorflow lite example model to detect cars and people, but it detects Many more types of objects. Is there any way to make it detect just these two
Whether it is discovering new, life-saving drugs, battling climate change, or creating accurate simulations of our world, these solutions demand an enormous—and rapidly growing—amount of processing power. They are increasingly out of reach of traditional computing approaches.
That is why industry has embraced NVIDIA GPU-accelerated computing. Combined with AI, it is bringing millionfold leaps in performance for scientific advancement. Today, 2,700 applications can benefit from NVIDIA GPU acceleration, and that number continues to rise, backed by a growing community of three million developers.
HPC application performance improvements
Delivering the many-fold speedups across the entire breadth of HPC applications takes relentless innovation at every level of the stack. This starts with chips and systems and goes through to the application frameworks themselves.
The NVIDIA platform continues to deliver significant performance improvements each year, with relentless advancements in architecture and across the NVIDIA software stack. Compared to the P100 released just six years ago, the H100 Tensor Core GPU is expected to deliver an estimated 26x higher performance, more than 3x faster than Moore’s Law.
Figure 1. NVIDIA HPC + AI platform performance from P100 to H100
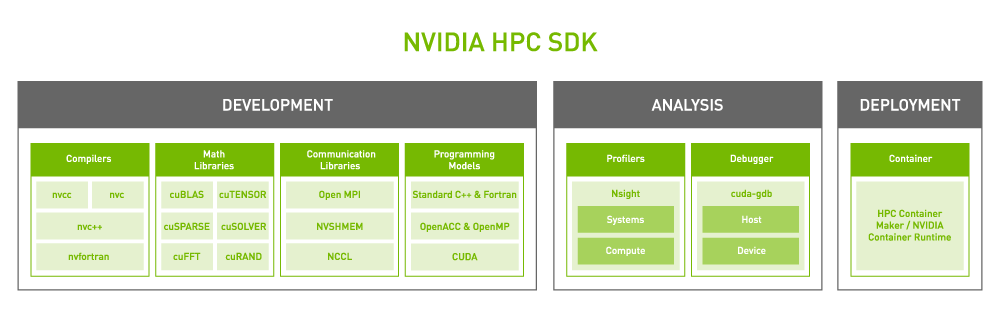
Figure 2. The NVIDIA HPC SDK has developer assets offered for each function.
Core to the NVIDIA platform is a feature-rich and high-performance software stack. To facilitate GPU acceleration for the widest range of HPC applications, the platform includes the NVIDIA HPC SDK. The SDK provides unmatched developer flexibility, enabling the creation and porting of GPU-accelerated applications using standard languages, directives, and CUDA.
The power of the NVIDIA HPC SDK lies in a vast suite of highly optimized GPU-accelerated math libraries, enabling you to harness the full performance potential of NVIDIA GPUs. For the best multi-GPU and multi-node performance, the NVIDIA HPC SDK also provides powerful communications libraries:
NVSHMEM creates a global address space for data that spans the memory of multiple GPUs.
Altogether, this platform provides the highest performance and flexibility to support the large and growing universe of GPU-accelerated HPC applications.
HPC performance and energy efficiency
To showcase how the NVIDIA full-stack innovation translates into the highest performance for accelerated HPC, we compared the performance of a server from HPE with four NVIDIA GPUs with that of a similarly configured server based on an equal number of accelerator modules from another vendor.
We tested a set of five widely used HPC applications using a wide variety of datasets. While the NVIDIA platform accelerates 2,700 applications spanning every industry, the applications we could use in this comparison were limited by the selection of software and application versions that are available for the other vendor’s accelerators.
For all workloads except for NAMD, which is software for molecular dynamics simulation, our results are calculated using the geomean of results across multiple datasets to minimize the influence of outliers and to be representative of customer experiences.
We also tested these applications in multi-GPU and single-GPU scenarios.
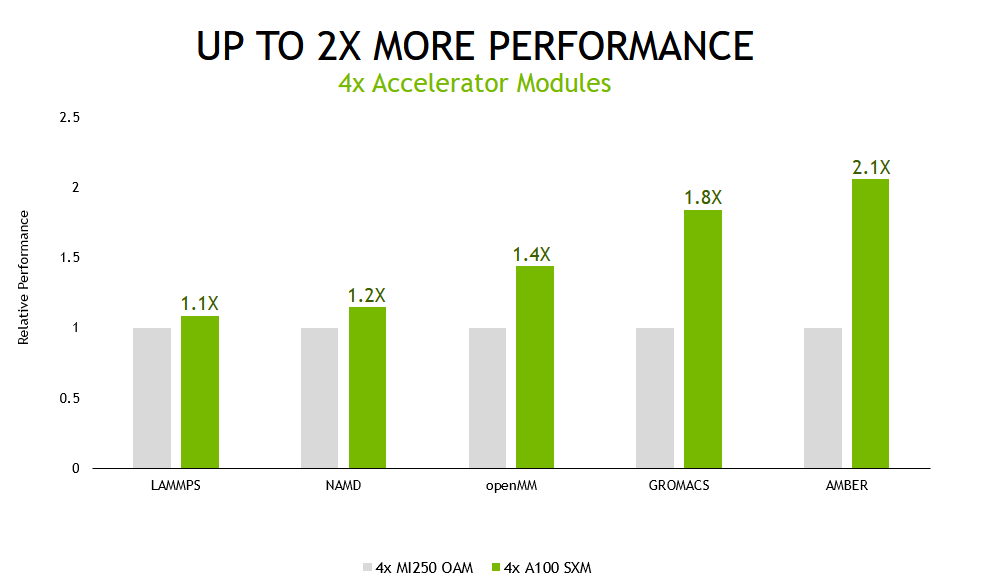
In the multi-GPU scenario, with all accelerators in the tested systems being used to run a single simulation, the A100 Tensor Core GPU-based server delivered up to 2.1x higher performance than the alternative offering.
Fueled by continued advances in compute performance, the field of molecular dynamics is moving towards simulating ever-larger systems of atoms for longer periods of simulated time. These advances enable researchers to simulate an increasing set of biochemical mechanisms, such as photosynthetic electron transport and vision signal transduction. These and other processes have long been the subject of scientific debate because they have been beyond the reach of simulation, which is the primary tool for validation. This was due to the prohibitively long amount of time needed to complete the simulations.
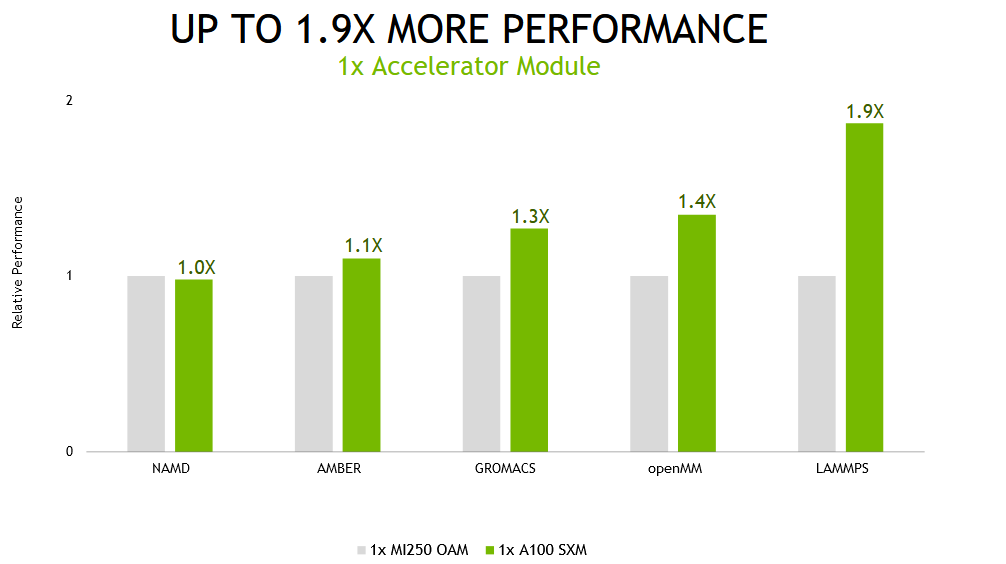
However, we recognize that not all users of these applications run them with multiple GPUs per simulation. For optimal throughput, the best execution method is often to assign one GPU per simulation.
When running these same applications on a single accelerator module—a full GPU on the NVIDIA A100 and both compute dies on the alternative product—the NVIDIA A100-based system delivered up to 1.9x faster performance.
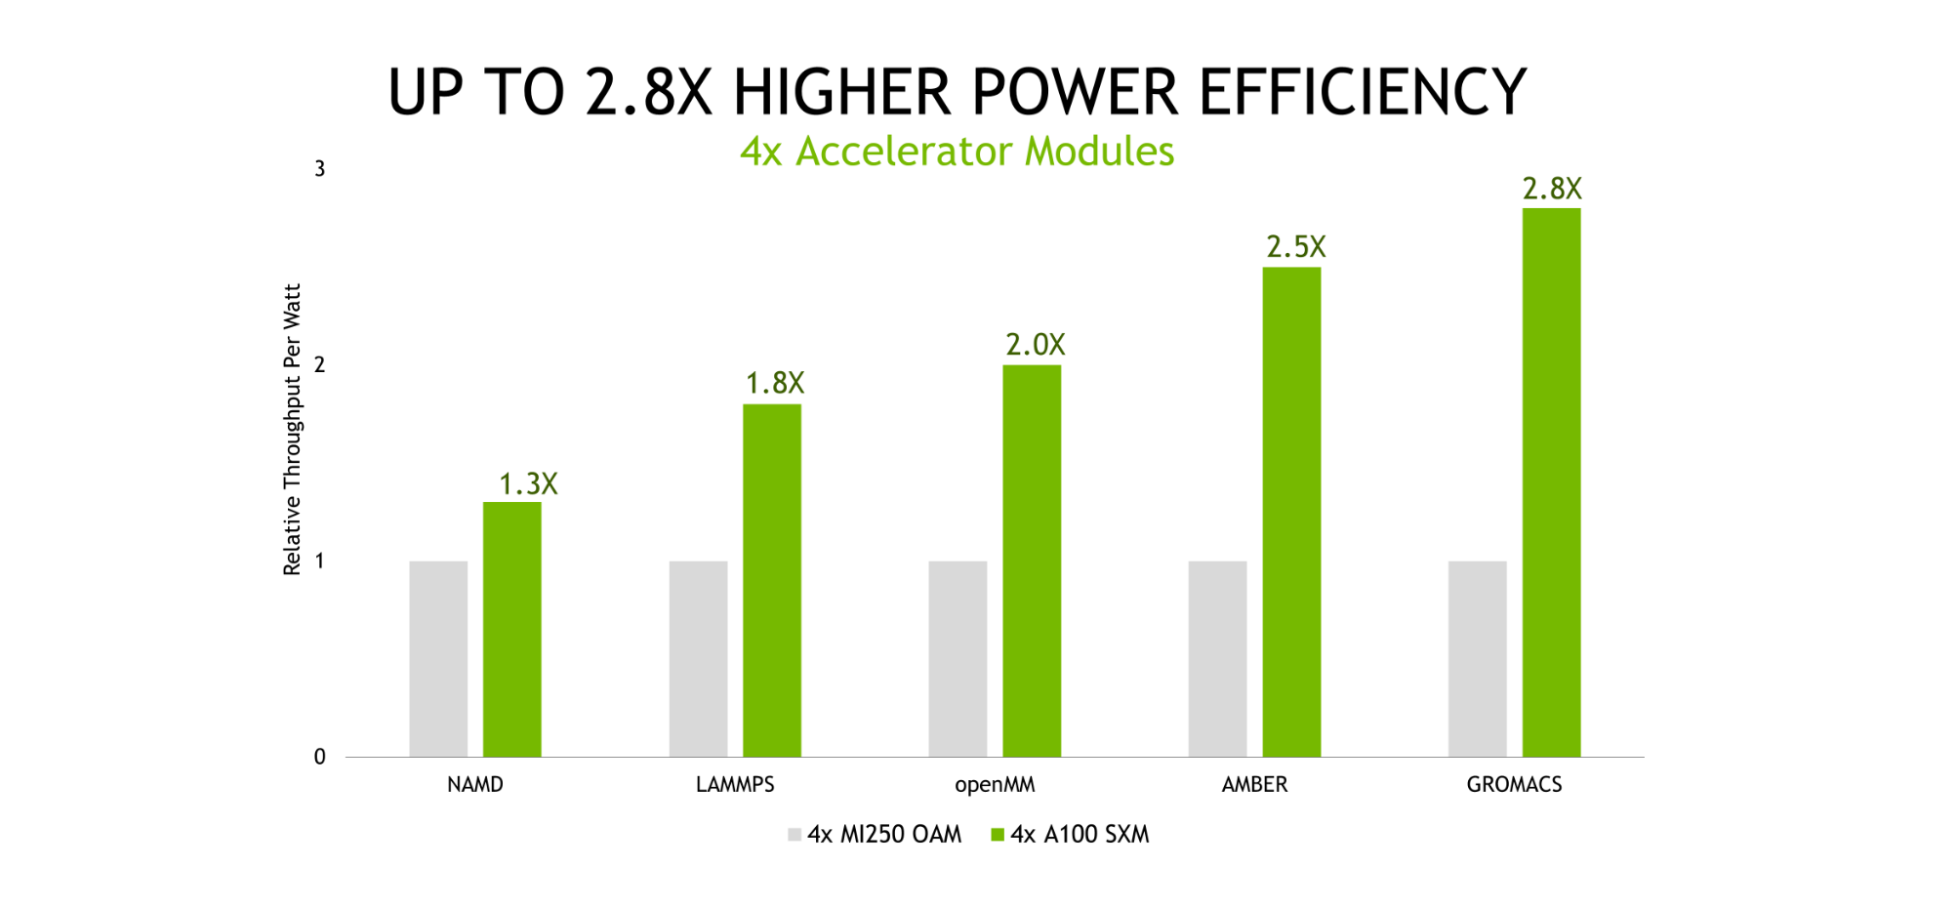
Energy costs represent a significant portion of the total cost of ownership (TCO) of data centers and supercomputing centers alike, underscoring the importance of power-efficient computing platforms. Our testing showed that the NVIDIA platform provided up to 2.8x higher throughput-per-watt than the alternative offering.
Figure 5. NVIDIA A100 power efficiency comparison
Efficiency ratio of A100 to MI250 shown – higher is better for NVIDIA. Geomean over multiple datasets (varies) per application. Efficiency is Performance / Power consumption (Watts) as measured for the GPUs using measured using NVIDIA SMI and equivalent functionality in ROCm |
AMD MI250 measured on a GIGABYTE M262-HD5-00 with (2) AMD EPYC 7763 with 4x AMD Instinct MI250 OAM (128 GB HBM2e) 500W GPUs with AMD Infinity Fabric technology. NVIDIA runs on ProLiant XL645d Gen10 Plus using dual EPYC 7713 CPUs and 4x A100 (80 GB) SXM4
The excellent performance and power efficiency of the NVIDIA A100 GPU is the result of many years of relentless software-hardware co-optimization to maximize application performance and efficiency. For more information about the NVIDIA Ampere architecture, see the NVIDIA A100 Tensor Core GPU whitepaper.
A100 also presents as a single processor to the operating system, requiring that only one MPI rank be launched to take full advantage of its performance. And, A100 delivers excellent performance at scale thanks to the 600-GB/s NVLink connections between all GPUs in a node.
AI and HPC convergence
Just as accelerated computing is bringing many-fold speedups to modeling and simulation applications, the combination of AI and HPC will deliver the next step-function increase in performance to unlock the next wave of scientific discovery.
In the three years between our first MLPerf training submissions and the most recent results, the NVIDIA platform has delivered 20x more deep learning training performance on this industry-standard, peer-reviewed suite of benchmarks. The gains come from a combination of chip, software, and at-scale improvements.
Figure 6. NVIDIA performance gains over three years
Scientists and researchers are already using the power of AI to deliver dramatic improvements in performance, turbocharging scientific discovery:
Supercomputing centers around the world are continuing to adopt accelerated AI supercomputers.
The Polaris supercomputer at the Argonne Leadership Computing Facility (ALCF), Perlmutter at NERSC, and Leonardo at CINECA are all powered by A100 Tensor Core GPUs.
The home-buying process can feel like an obstacle course — finding the perfect place, putting together an offer and, the biggest hurdle of all, securing a mortgage. San Francisco-based real-estate technology company Doma is helping prospective homeowners clear that hurdle more quickly with the support of AI. Its machine learning models accelerate properties through the Read article >
Learn more about new features and ways to improve system performance using Nsight Compute 2022.2
NVIDIA Nsight Compute is an interactive kernel profiler for CUDA applications. It provides detailed performance metrics and API debugging through a user interface and a command-line tool. Nsight Compute 2022.2 includes features to expand the supported environments and workflows for CUDA kernel profiling and optimization.
The following outlines the feature highlights of Nsight Compute 2022.2.
NVIDIA OptiX acceleration structure viewer
With the new NVIDIA OptiX acceleration structure viewer, users can inspect the structures they build before launching a ray-tracing pipeline. Acceleration structures describe a rendered scene’s geometries for ray-tracing intersection calculations. Users create these acceleration structures and OptiX translates them to internal data structures. Sometimes the description created by the user is error prone and it can be difficult to understand why the rendered result is not as expected or what is limiting performance.
With this new feature, users can navigate through them in a 3D visualizer and view the parameters used during their creation like build flags, triangle mesh vertices, and AABB coordinates. This viewer is useful to identify overlaps or inefficient hierarchies, resulting in subpar ray-tracing performance.
Figure 1. Nsight Compute acceleration structure viewer with 3D scene navigation
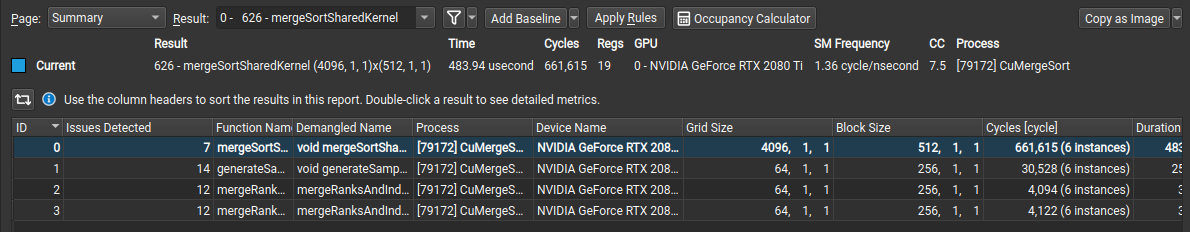
Issues detection per kernel
The latest version adds a new “Issues Detected” column to the summary page for users to sort all profiled kernels by the number of performance issues detected. This gives users guidance on where to focus their efforts across multiple results (kernel profiles). If users are unsure which kernel to focus their optimization efforts on, a long running kernel with a high number of detected issues is a good starting point.
Figure 2. Issues detected column in summary page identifies kernels with the most performance issues
Additional improvements
There are improvements to the metric grouping and selection options on the source page to make them easier to use. Additionally, this release adds support for running the Nsight Compute user interface on ARM SBSA and L4T based platforms, for users to profile without needing remote connections or separate host machines for the user interface.
Check out the sessions below released at NVIDIA GTC 2022 showcasing Nsight tool capabilities, support with Jetson Orin, and more.
Google worked with Australia’s national science agency to train ML models that monitor and map harmful coral-eating crown-of-thorns starfish outbreaks along the Great Barrier Reef.
Marine biologists have a new AI tool for monitoring and protecting coral reefs. The project—a collaboration between Google and Australia’s Commonwealth Scientific and Industrial Research Organization (CSIRO)—employs computer vision detection models to pinpoint damaging outbreaks of crown-of-thorns starfish (COTS) through a live camera feed. Keeping a closer eye on reefs helps scientists address growing populations quickly, to protect the valuable Great Barrier Reef ecosystem.
Despite covering less than 1% of the vast ocean floor, coral reefs support about 25% of sea species including fish, invertebrates, and marine mammals. When healthy, these productive marine environments provide commercial and subsistence fishing and income for tourism and recreational businesses. They also protect coastal communities during storm surges and are a rich source of antiviral compounds for drug discovery research.
Assemblages of COTS are found throughout the Indo-Pacific region and feed on coral polyps—the living part of hard coral reefs. They typically occur in low numbers, posing little harm to the ecosystem. However, as outbreaks increase in frequency—in part due to nutrient run-off and a decline in natural predators—they are causing significant damage.
Healthy reefs take about 10 to 20 years to recover from COTS outbreaks, defined by 30 or more adults per 10,000 square meters, or when densities consume coral faster than it can grow. Degraded reefs facing environmental stressors such as climate change, pollution, and destructive fishing practices are less likely to recover, resulting in irreversible damage, diminished coral cover, and biodiversity loss.
Scientists control outbreaks through interventions. Two common approaches involve injecting a starfish with bile salts or removing populations from the water. But, traditional reef surveying, which consists of towing a snorkeler behind a boat for visual identification, is time-consuming, labor-intensive, and less accurate.
According to the project’s TensorFlow post, “CSIRO developed an edge ML platform (built on top of the NVIDIA Jetson AGX Xavier) that can analyze underwater image sequences and map out detections in near real time.” The authors, Megha Malpani an AI/ML product manager at Google, and Ard Oerlemans a Google software engineer, are part of a team of researchers working with CSIRO to build the most accurate and performant models.
Video 1. Learn about how Google teamed up with CSIRO to create an ML model that helps monitor harmful species on the Great Barrier Reef
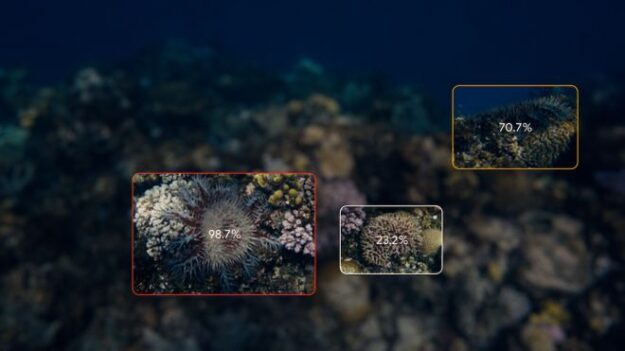
Employing an annotated dataset from CSIRO the researchers developed an accurate object detection model that uses a live camera feed rather than a snorkeler to detect the starfish.
It processes images at more than 10 frames per second with precision across a variety of ocean conditions such as lighting, visibility, depth, viewpoint, coral habitat, and the number of COTS present.
According to the post, when a COTS starfish is detected, it is assigned a unique ID tracker, linking detections over time and video frame. “We link detections in subsequent frames to each other by first using optical flow to predict where the starfish will be in the next frame, and then matching detections to predictions based on their Intersection over Union (IoU) score,” Malpani and Oerlemans write.
With the ultimate goal of quickly determining the total number of COTS, the team focused on the entire pipeline’s accuracy. The “current 1080p model using TensorFlow TensorRT runs at 11 FPS on the Jetson AGX Xavier, reaching a sequence-based F2 score of 0.80! We additionally trained a 720p model that runs at 22 FPS on the Jetson module, with a sequence-based F2 score of 0.78,” the researchers write.
Figure 1. A rendering of labeled COTS starfish on a reef (credit: Google/CSIRO)
According to the study, the project aims to showcase the capability of machine learning and AI technology applications for large-scale surveillance of ocean habitats.

 Monitor DPUs, validate RoCE deployments, gain network insights through flow-based telemetry analysis, and centrally view network events with NetQ 4.2.0.
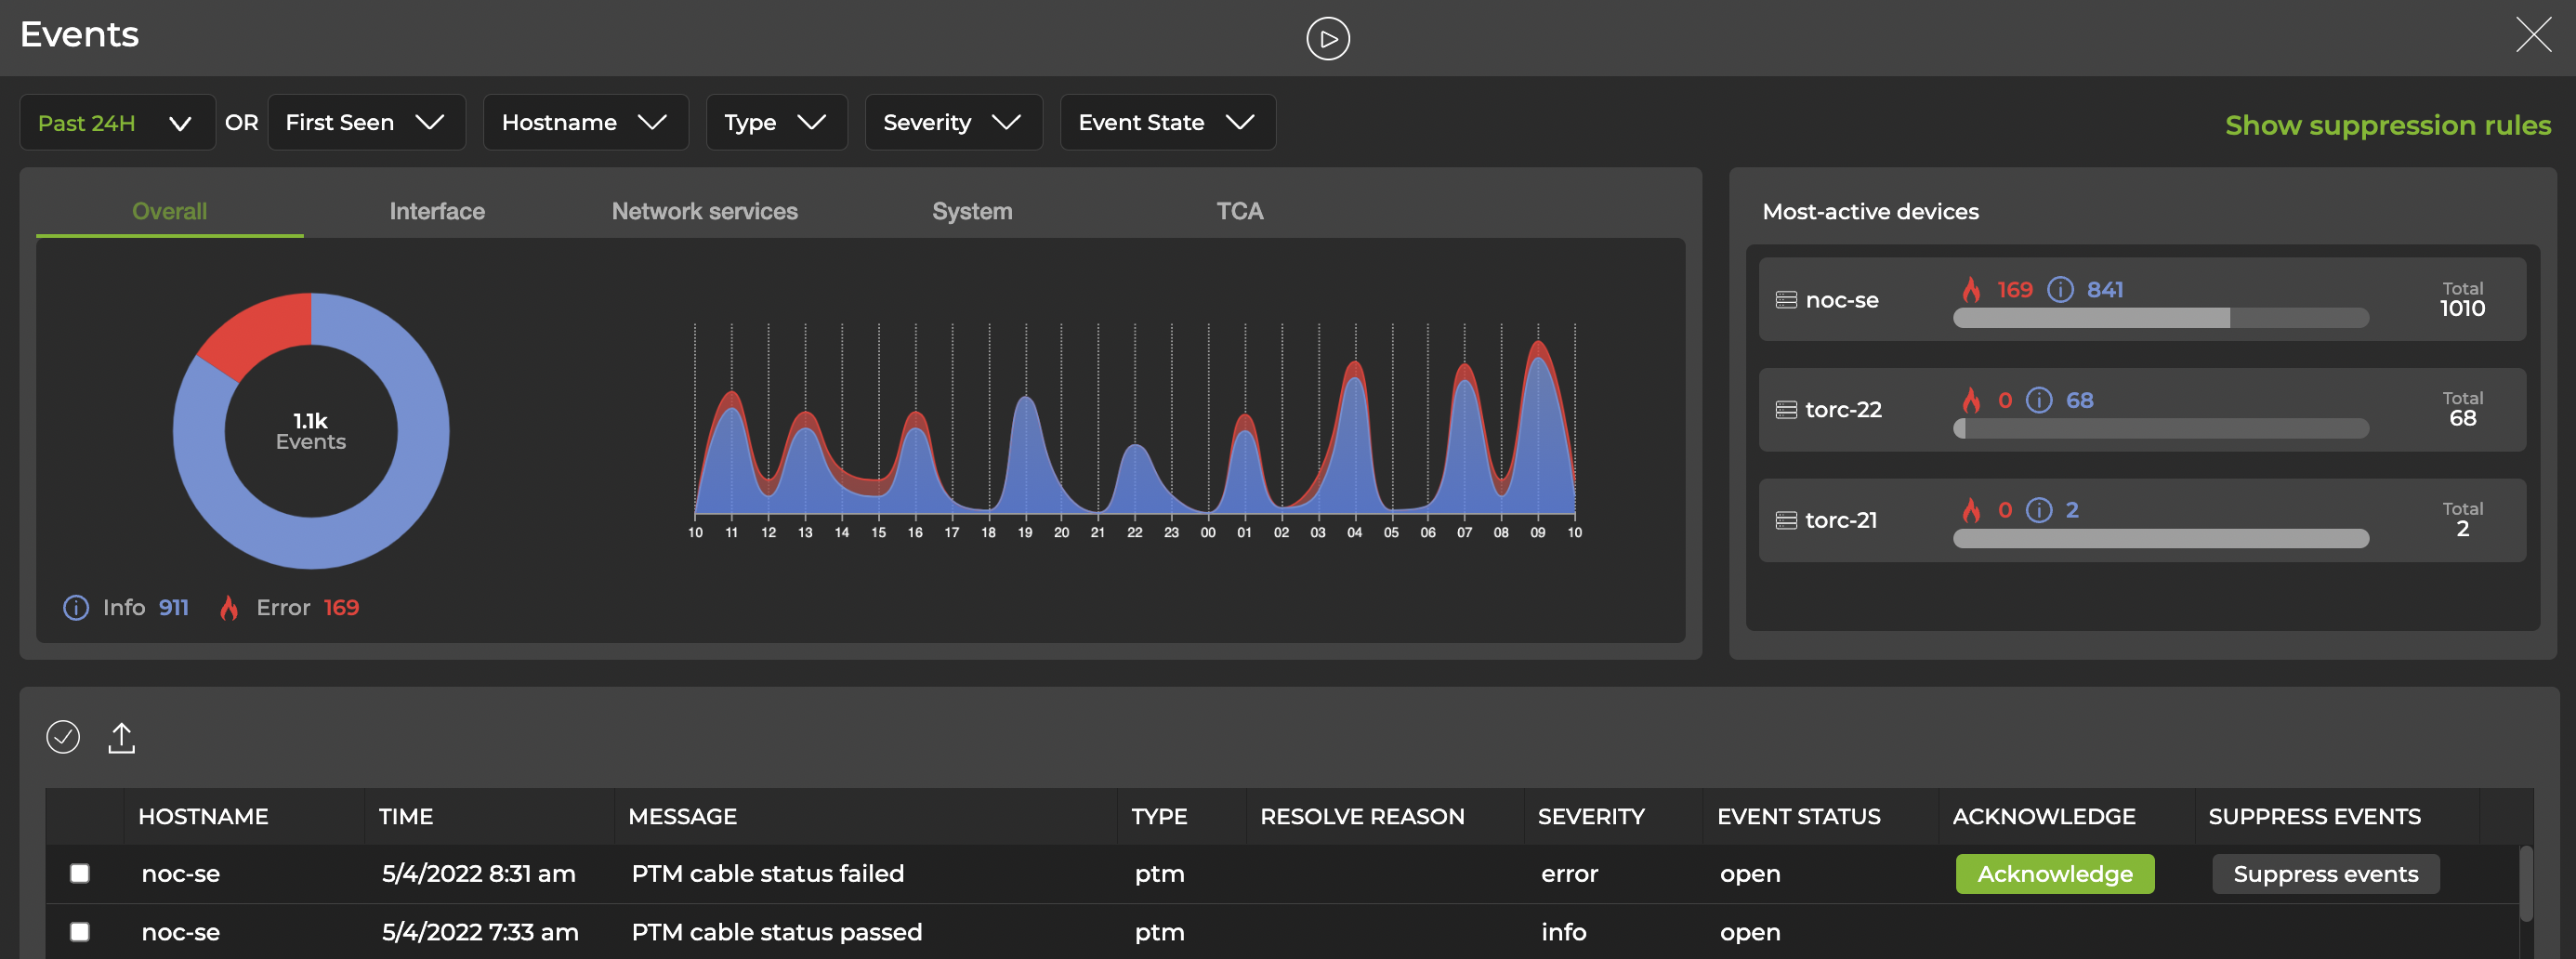


 The NVIDIA platform, powered by the A100 Tensor Core GPU, delivers leading performance and versatility for accelerated HPC.
 MI250 OAM (128 GB HBM2e) 500W GPUs with AMD Infinity Fabric
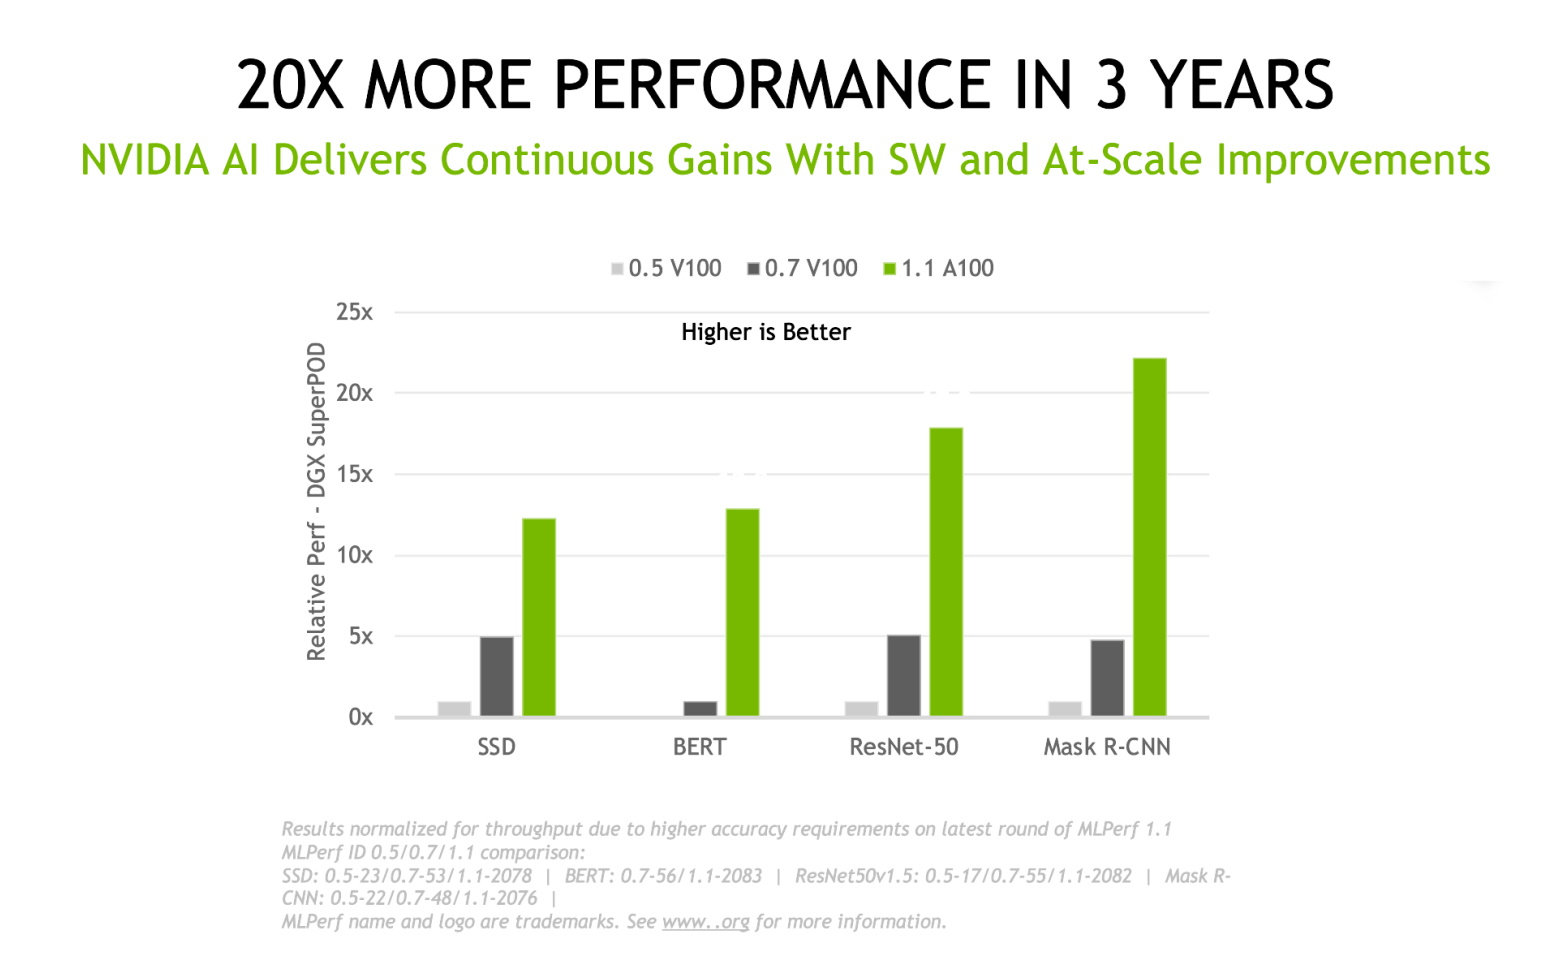
 Learn more about new features and ways to improve system performance using Nsight Compute 2022.2
 ![Nsight Compute Acceleration Structure Viewer provides 3D Scene Navigation and metrics]](https://developer-blogs.nvidia.com/wp-content/uploads/2022/05/image3-3-625x379.png)
 Google worked with Australia’s national science agency to train ML models that monitor and map harmful coral-eating crown-of-thorns starfish outbreaks along the Great Barrier Reef.