Researchers tackling the challenge of visual misinformation — think the TikTok video of Tom Cruise supposedly golfing in Italy during the pandemic — must continuously advance their tools to identify AI-generated images. NVIDIA is furthering this effort by collaborating with researchers to support the development and testing of detector algorithms on our state-of-the-art image-generation models. Read article >
This week’s GFN Thursday packs a prehistoric punch with the release of Jurassic World Evolution 2. It also gets infinitely brighter with the release of Bright Memory: Infinite. Both games feature NVIDIA RTX technologies and are part of the six titles joining the GeForce NOW library this week. GeForce NOW RTX 3080 members will get Read article >
For millions of professionals around the world, 3D workflows are essential. Everything they build, from cars to products to buildings, must first be designed or simulated in a virtual world. At the same time, more organizations are tackling complex designs while adjusting to a hybrid work environment. As a result, design teams need a solution Read article >
The earth is warming. The past seven years are on track to be the seven warmest on record. The emissions of greenhouse gases from human activities are responsible for approximately 1.1°C of average warming since the period 1850-1900. What we’re experiencing is very different from the global average. We experience extreme weather — historic droughts, Read article >
The appetite for AI and data science is increasing, and nowhere is that more prevalent than in emerging markets. Registrations for this week’s GTC from African nations tripled compared with the spring edition of the event. Indeed, Nigeria had the third most registered attendees for countries in the EMEA region, ahead of France, Italy and Read article >
Introducing the first GPU+DPU in a single package.
The modern data center is becoming increasingly difficult to manage. There are billions of possible connection paths between applications and petabytes of log data. Static rules are insufficient to enforce security policies for dynamic microservices, and the sheer magnitude of log data is impossible for any human to analyze.
AI provides the only path to the secure and self-managed data center of the future.
The NVIDIA converged accelerator is the world’s first AI-enhanced DPU. It combines the computational power of GPUs with the network acceleration and security benefits of DPUs, creating a single platform for AI-enhanced data center management. Converged accelerators can apply AI-generated rules to every packet in the data center network, creating new possibilities for real-time security and management.
Figure 1. In standard mode, the BlueField-2 DPU and GPU are connected by a dedicated PCIe Gen4 switch for full bandwidth outside of the host PCIe system.
At NVIDIA GTC, we are introducing two new converged accelerators. The A100X combines an A100 Tensor Core GPU with a NVIDIA BlueField-2 data processing unit on a single module. The A30X combines an A30 Tensor Core GPU with the same BlueField-2 DPU. The converged cards have the unique ability to extend the BlueField-2 capabilities of offloading, isolating, and accelerating the network to include AI inference and training.
Both accelerators feature an integrated PCIe switch between the DPU and GPU. The integrated switch eliminates contention for host resources, enabling line-rate GPUDirect RDMA performance. The integrated switch also improves security by isolating data movement between the GPU and NIC.
AI enhanced DPU
The converged accelerators support two modes of operation:
Standard–The BlueField-2 DPU and the GPU operate separately.
BlueField-X–The PCI switch is reconfigured so the GPU is dedicated to the DPU and no longer visible to the host system.
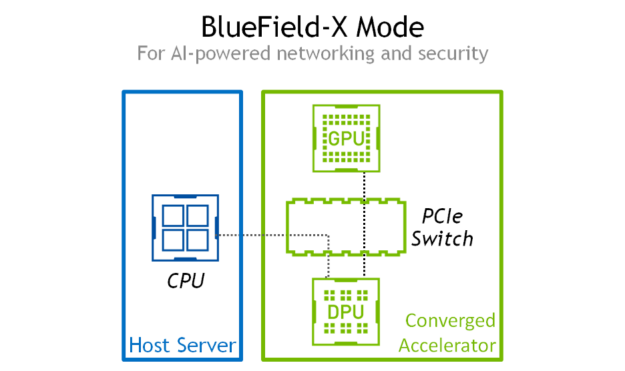
In BlueField-X mode, the GPU is dedicated exclusively to the operating system running on the DPU. BlueField-X mode creates a new class of accelerator never before seen in the industry: a GPU-accelerated DPU.
Figure 2. In BlueField-X mode the x86 host only sees the BlueField-2 DPU, allowing the DPU to run AI workloads on the network data.
In BlueField-X mode, the GPU can run AI models on the data flowing through the DPU as a “bump in the wire.” There is no performance overhead and no compromise on security. The AI model is fully accelerated without consuming host resources.
BlueField-X unlocks novel use cases for cybersecurity, data center management, and I/O acceleration. For example, the Morpheus Cybersecurity framework uses machine learning to take action on security threats that were previously impossible to identify. Morpheus uses DPUs to harvest telemetry from every server in the data center and send it to GPU-equipped servers for analysis.
With BlueField-X, the AI models can run locally on the converged accelerator in each server. This allows Morpheus to analyze more data, faster, while simultaneously eliminating costly data movement and reducing the attack surface for malicious actors. Malware detection, data exfiltration prevention, and dynamic firewall rule creation are Morpheus use cases enabled by BlueField-X.
The Morpheus example only scratches the surface of what is possible with BlueField-X. Our customers routinely share ideas that we had not yet considered. To enable more creative exploration of AI-enabled networks, we are introducing the NVIDIA Converged Accelerator Developer Kit.
With this developer kit, we provide early access to A30X accelerators for select customers and partners building the next generation of accelerated AI network applications. Discover new applications for BlueField-X in edge computing or data center management. Some ideas to help get you started include:
Transparent video preprocessing–Bump-in-the-wire video preprocessing (decryption, interlacing, format conversion, etc) to improve IVA throughput and camera density.
Small-cell RU solution–RAN signal processing on a converged accelerator to increase subscriber density and throughput on a commodity gNodeB server.
Computational storage–Bump-in-the-wire storage encryption, indexing, and hashing to offload costly CPU cycles from a storage host preparing data for long-term storage.
Cheating detection–Detect malicious gameplay/cheating in a streaming gaming service
Get started with the NVIDIA Converged Accelerator Developer Kit
The NVIDIA Converged Accelerator Developer Kit contains sample applications that combine CUDA and NVIDIA DOCA, and documentation to help you install, configure your new converged accelerator. Most importantly, we provide access to an A30X and usage support in exchange for feedback.
To get started, simply register your interest on the NVIDIA Converged Accelerator Developer Kit webpage. If approved, we will contact you once the hardware is ready to ship and you can start building the next generation of accelerated applications.
We hope that you share our excitement for building a new class of real-time AI applications for data center management and edge computing. Let the discovery begin.
Nsight Systems helps you tune and scale software across CPUs and GPUs.
The latest update to NVIDIA Nsight Systems—a performance analysis tool—is now available for download. Designed to help you tune and scale software across CPUs and GPUs, this release introduces several improvements aimed to enhance the profiling experience.
Nsight Systems is part of the powerful debugging and profiling NVIDIA Nsight Tools Suite. You can start with Nsight Systems for an overall system view and avoid picking less efficient optimizations based on assumptions and false-positive indicators.
2021.5 highlights
Statistics now available in user interface
Multi-report view with horizontal and vertical layouts to aid investigations across server nodes, VMs, containers, ranks, and processes (coming soon)
Expert system now includes GPU utilization analysis for OpenGL and DX12
NVIDIA NIC Infiniband metrics sampling (experimental)
DirectX12 memory operations and warnings
DXGI/DX12/Vulkan API calls correlation to WDDM queue packets
Windows 11 support
Multireport view enhancements (coming soon) can improve investigations. They support merging into a single timeline reports that are continuations of existing sessions or reports captured simultaneously from other server nodes, VMs, container, rank, and process.
Figure 1. Two MPI ranks from separate report files viewed together on a shared timeline
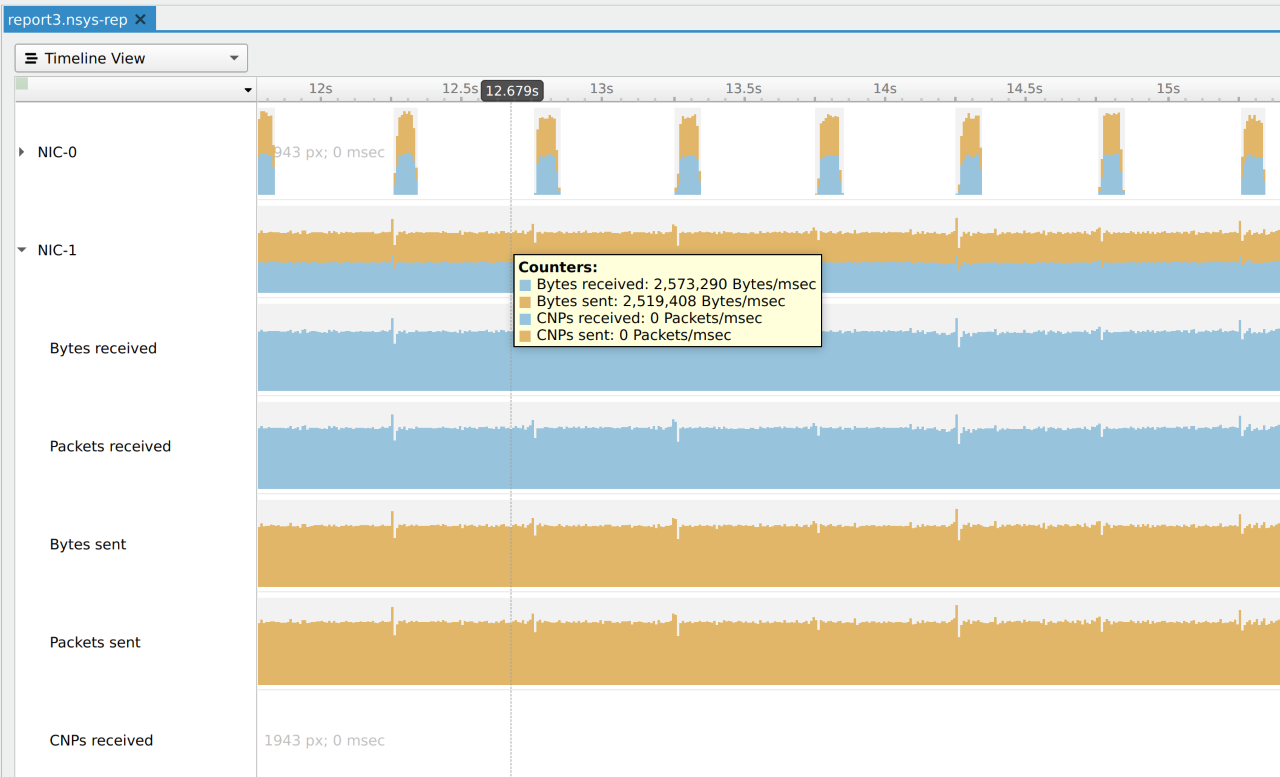
NVIDIA NIC Infiniband metrics sampling (experimental) enables you to understand details of server communications, such as throughput, packet counts, and congestion notifications.
Figure 2. NVIDIA NIC Infiniband metrics sampling
Using DirectX12 trace, a new memory operations row highlights memory usage warnings and situations where expensive functions are called when resources are non-persistently mapped.
Figure 3. DirectX12 memory operations and warnings
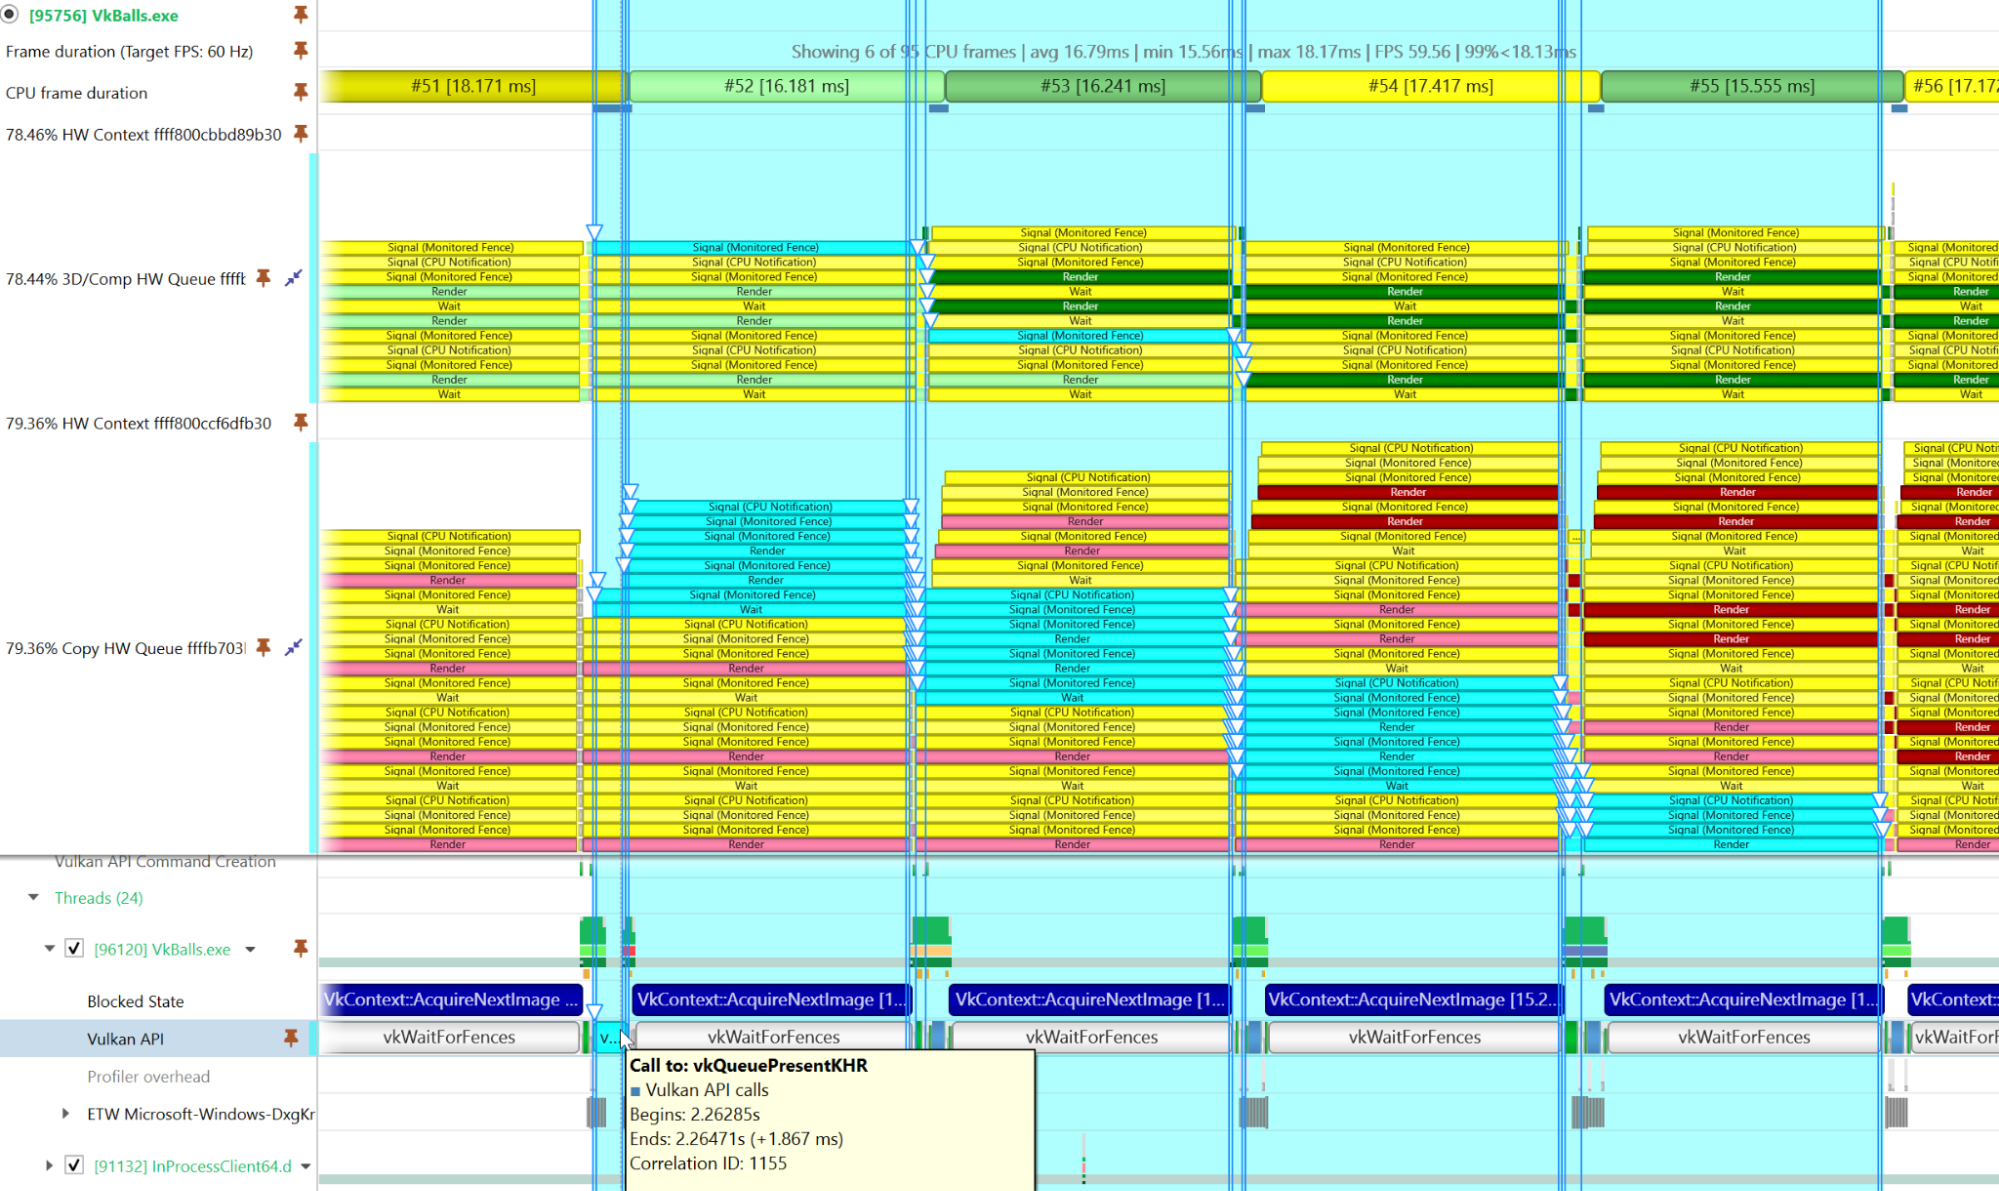
WDDM trace now correlated graphics API calls to queue packets so that you can better understand workload creation and its progress through the Windows display driver model.
Figure 4. DXGI, DX12, and Vulkan API call correlation to WDDM queue packets
For more information, see the following resources:
Learn how building models with NVIDIA Data Science Workbench can improve management and increase productivity.
Data scientists wrestle with many challenges that slow development. There are operational tasks, including software stack management, installation, and updates that impact productivity. Reproducing state-of-the-art assets can be difficult as modern workflows include many tedious and complex tasks. Access to the tools you need is not always fast or convenient. Also, the use of multiple tools and CLIs adds complexity to the data science lifecycle.
Master your Data Science environment
Building data science models is easier said than done. That’s why we are announcing NVIDIA Data Science Workbench to simplify and orchestrate tasks for data scientists, data engineers, and AI developers. Using a GPU-enabled mobile or desktop workstation, users can easily manage the software development environment for greater productivity and ease-of-use while quickly reproducing state-of-the-art examples to accelerate development. Through Workbench, key assets are just a click away.
Figure 1: NVIDIA Data Science Workbench and Enterprise Data Science Stack.
Workbench enhances the development experience in several ways:
Better management
Easily set up your work environment and manage NVIDIA Data Science Stack software versions. Access tools that provide optimized frameworks for GPU accelerated performance as well as automatic driver, CUDA, nv-docker, and NGC container updates. Also, get notified about other important updates.
Easy reproducibility
Build quality models faster based on state-of-the-art example code. Dockerize GitHub content and reproduce assets for your Jupyter environment. Use NGC the container for GPU-optimized code that also runs in AWS.
Greater productivity
Easy software and driver installation, quickly access the Jupyter notebook, software assets, Kaggle notebooks, GitHub, and more. Use NGC containers for GPU-optimized code that also runs in AWS.
Try Workbench
The released version for Ubuntu 18.04 and 20.04 is now available. Click here for installation instructions. Also, watch this 90-second Workbench demo:
Video 1: The video shows Workbench as a desktop application and illustrates NGC, Kaggle, and various data science tools and assets are easily accessed.
“I installed the NVIDIA Data Science Workbench and quickly discovered that it was easy to reproduce Git content and download NGC containers for use in Jupyter. I was pleasantly surprised to learn that Workbench installs a data science software environment for you as well as addressing updates – which is usually a big hassle and a big consumption of time. I’d expect Workbench will become a popular tool for anyone building deep-learning models and other data science projects.”
Dr. Chanin Nantasenamat Associate Professor of Bioinformatics at Mahidol University Founder of Data Professor YouTube Channel
Attend our session at the NVIDIA GTC Conference to learn more about Workbench. GTC registration is required (registration is free).
Date and Time: November 11, 2021 at 3:00am – 3:50am Pacific Time (on-demand afterward)
Workbench – your personal assistant
NVIDIA Data Science Workbench can make you more productive by providing a convenient framework on workstations for building models that use best practices. Workbench will run on most GPU-enabled workstations, but NVIDIA-Certified Workstations are recommended. In the end, it’s easier to manage, reproduce, and leverage NGC, Kaggle, and Conda for helpful assets.
Workbench won’t build your code for you, but it will accelerate development, reduce confusion, and help deliver better quality models in less time. To learn more, read the Workbench webpage, or visit the Workbench forum.
NVIDIA announced the latest release in Nsight Graphics, which supports Direct3D, Vulkan, OpenGL, OpenVR, and the Oculus SDK.
Today, NVIDIA announced Nsight Graphics 2021.5, the latest release, which supports Direct3D (11, 12, and DXR), Vulkan (1.2, NV Vulkan Ray Tracing Extension), OpenGL, OpenVR, and the Oculus SDK. Nsight Graphics is a standalone developer tool that enables you to debug, profile, and export frames built with high-fidelity 3D graphics applications.
Key features:
Full Windows 11 support for both API Capture and Tracing.
Acceleration Structure Viewer with Bounding Volume Overlap Analysis.
Users are able to specify the continual refresh flag via the Nsight API.
Support for Linux NGX.
Developers now have full support for Windows 11 for all activities, including Frame Profiling and GPU Trace profiling. The Acceleration Structure Overlap Analyzer is a noteworthy addition to this release as it helps to ensure that NVIDIA RTX ray tracing applications are efficiently traversing bounding volumes in your scene. This has direct implications on performance, making it an important feature for anyone looking to optimize their ray tracing applications.
Technical overview of the Nsight DL Designer tool to help ease the process of performant model design.
NVIDIA Nsight Deep Learning Designer is a new tool that helps ease the process of performant model design. DL Designer provides valuable insights into the structure of the model, and how well it performs on NVIDIA hardware. Models can be created with a user-friendly, drag-and-drop interface that features nodes for all of the commonly used operators available in the most popular deep learning frameworks.
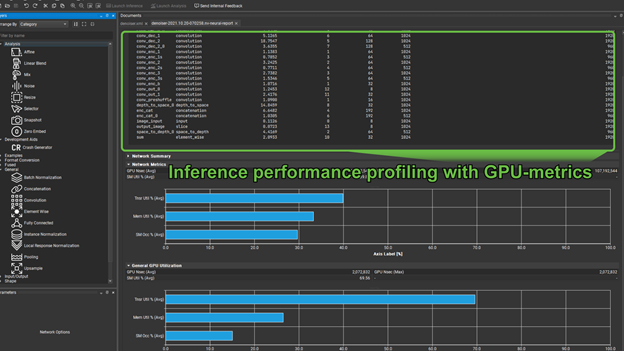
Performance profiling
Understanding the performance characteristics of a model is essential right from the outset. After the model is designed, you can profile it for performance.
To select and view the latest profiling report, choose Launch Inference, View, Inference Run Logger.
This is divided into two major sections. The first, shown previously, gives you a table of operators, their hyperparameters, and execution times. These are, by default, listed in order of priority to optimize (akin to how nvprof lists kernels in order of optimization priority).
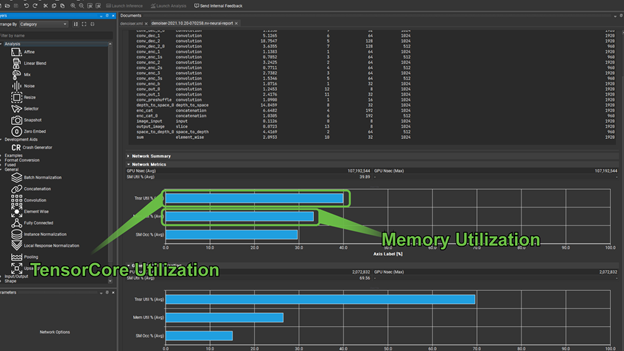
An important question for any model running on NVIDIA hardware, for both training and inference is, “Is this model using Tensor Cores”? The second part of the profiling report shows the utilization of Tensor Cores.
There are two groups of graphs here, the first gives you the Tensor Core utilization, along with memory throughput, and SM occupancy for the entire network. The second gives these same metrics for an individually selected operator from the preceding list. In cases where Tensor Core utilization is not meaningful, for example in the case of a pooling operator, the Tensor Core utilization shows as zero.
Memory utilization can quickly tell you if you are memory-bound. In cases such as this, it is prudent to look for opportunities to fuse operators where appropriate to use faster memory. Training time can be hugely reduced if you use the GPU hardware effectively. When training large models, or using cloud-based services, this can quickly translate into greatly reduced production costs.
Training the model
After you have profiled your model for performance improvements, you can export the model to PyTorch and perform training. Improvement areas can include ensuring FP16, when NHWC layout is used and you have at least multiples of eight input/output channels for your conv2d convolutions.
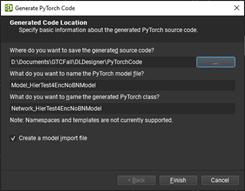
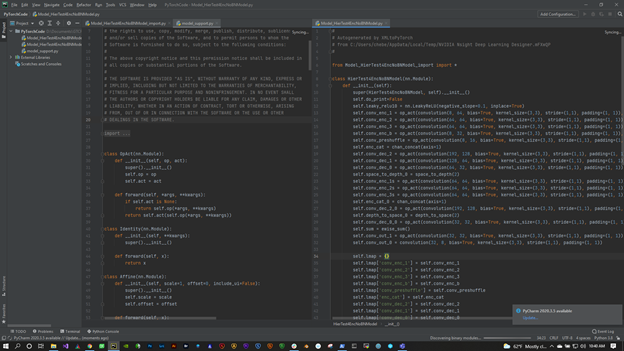
To export to PyTorch, choose File, Export, Generate PyTorch Files (Figure 3).
Figure 3. Generating PyTorch code from DL Designer
Exporting your model to PyTorch gives you a few options to check the names of the model, and files that are selected for you. But, you must specify an output directory for your PyTorch files, which consists of a trainable model and some utility methods to work with it.
To export to PyTorch, you must have a Python 3 environment in your PATH environment variable and the following modules:
PyTorch
Numpy
Pillow
Matplotlib
Fastprogress
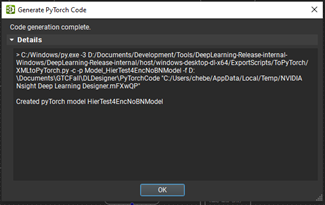
Upon successful generation, close the Code generation complete dialog box.
Figure 4. Completing your PyTorch code generation step.
Analyzing the model
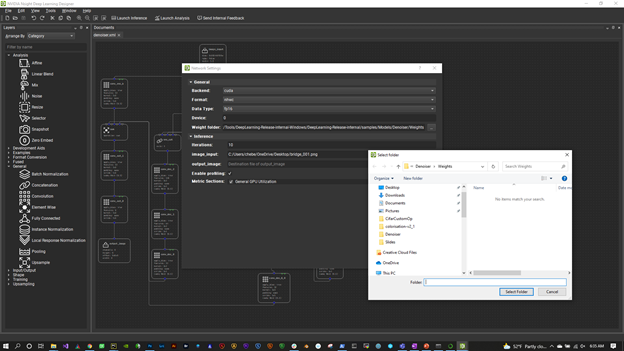
Figure 5. Training model and applying weights to analyze performance.
Now your code is ready to work with! The next step is to get it trained and the weights loaded back into DL Designer so that you can analyze how well the model is performing the task for which it was designed.
The model here is a denoiser model. It is in the samples that you can try for yourself. The first thing to do is load it into DL Designer. Next get and apply the weights that you got from the training in PyTorch.
To configure the trained model, choose Tools, Network Settings.
Figure 6. Network Settings
The first thing to look at is the Weights Folder. Select the directory where you output your trained weights. DL Designer picks these up and applies them to the appropriate operators.
Also, make sure that you are set to FP16, NHWC layout, and the CUDA backend. To use the fast Tensor Cores for operations such as convolutions and GEMMs (matrix multiplications), use FP16. To get the fastest throughput, use NHWC.
Now, you can begin performing some visual analysis on the model. Before you do that, use some of the DL Designer analysis features and add a few handy nodes to the trained model to help you evaluate its performance as a denoiser.
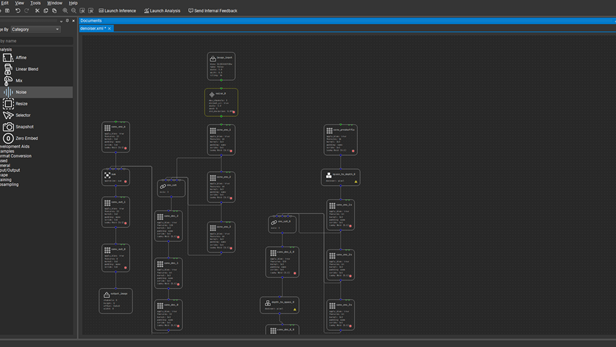
Analysis layers
Figure 7. View of the Analysis section of the Layers palette.
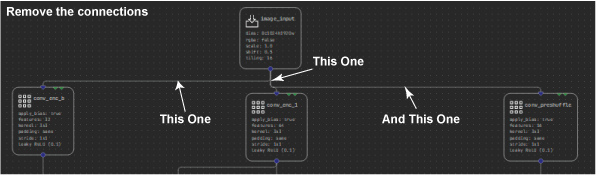
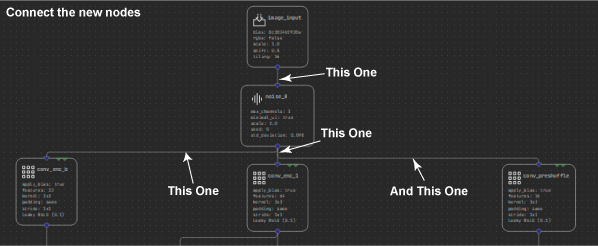
Start by expanding the Analysis section of the Layers palette. The first new layer to add is the Noise layer. This helps you inject some noise into the input image, so that you can evaluate how well the denoiser is reconstructing the image without it. To do this, first select and delete the connections between Input_image and the three nodes it connects with: conv_enc_b, conv_enc_1, and conv_preshuffle.
Figure 8. Adding a Noise layer to test the denoiser.
Now select and shift the image input node up a touch so that you can fit the noise layer in between. Finally, connect the input _image node to the new Noise layer, then connect the new layer to the three nodes that were previously connected from the image input. When you run this model, you can control how much noise to add to the image.
Figure 9. Connecting the Noise layer to the three nodes connected to input_image.
Before you run the analysis, there is one more node that you might find useful: the Mix node. This node enables you to compare the final denoised output with the original input, before the noise was added. As you see, you can perform this comparison in a variety of ways that give you a good idea as to how well your model is performing.
Delete the connection between conv_out_0 and output_image and then insert the Mix node in between these two, much like you did with the noise node by replacing the connections. I recommend caution as the mix node actually has two inputs.
You have already specified conv_out_0 as one input. Now add the other input to connect to the output of the original image layer, right at the top of the model, before you add the noise.
So far, you’ve added handy utilities to help analyze the model. At this point, save your model as denoiser_analyze.xml (or something similar) and choose Launch Analysis to see the model in action. Here is a quick breakdown of the user interface:
image_input_data—Right-click and choose Open Image Input to browse for a JPG or PNG file for use as the original input. When you choose Ok, the model springs into life and the output of the model is displayed in the central panel.
Noise and Mix—Options for the two analysis layers just added.
Network overview—The graph of nodes as they are being executed by the model inference.
Customizing design inspection
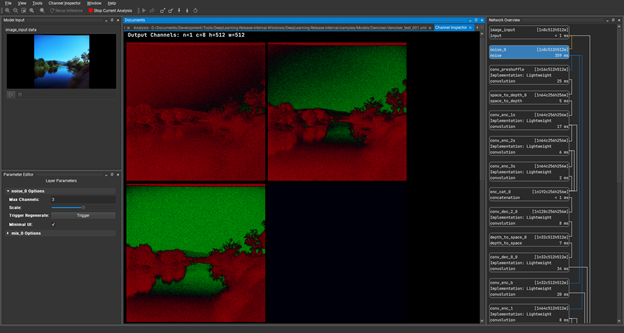
To continue, double-click on the Noise layer, which is the second layer down under Network Overview. Through the Channel Inspector under this tab, you can see the individual channels of the tensors that are produced during inference, which are the hidden layers. With the Noise layer channels in view, you can now go back to the noise layer options at the bottom right of the screen. Drag the Scale slider a little to the right and see the amount of noise showing on the image input increase.
Figure 10. Using the Channel Inspector feature to identify and distinguish individual channels of the tensors produced during inference
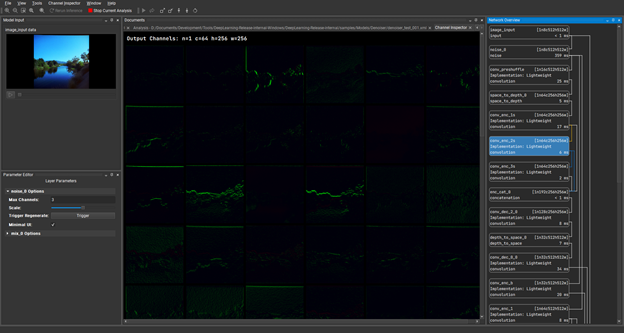
Under Channel Inspector, double-click the conv_enc_2s layer and load the channels of that hidden layer. This is showing the results of the convolution operation at the point during inference.
Figure 11. Channel inspector loading hidden layers as a result of a convolution operation at the point during inference
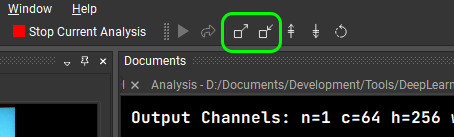
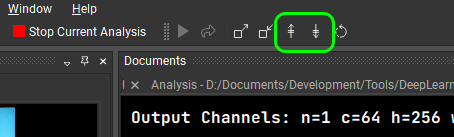
The features in these channels are a little faint, but you can boost them a bit by choosing the scale up icon (Figure 12).
Figure 12. Scaling up or down the channel brightness
This gives you a better idea of how these layers are performing and you can see clearly that there is nothing collapsing here. You have got strong signals propagating through the model. Any data displayed as green is positive in value and any data displayed as red is negative.
You can also shift the displayed values with the shift buttons, enabling you to push everything to display as positive or negative values.
Figure 13. Shift the displayed values to display as positive or negative
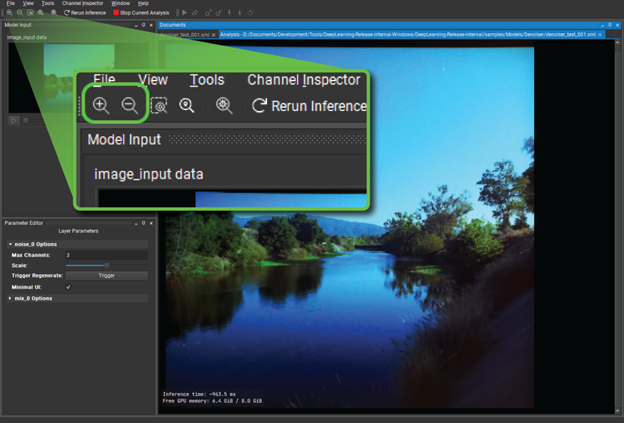
Have a look at the final output of the model and compare it with the original input. This is where the mix layer comes into play. Close down the channel inspector and look at the image output again. Use the Zoom button in the top left corner to make that output fill the user interface so that you can really see what is going on.
Figure 14. Two Zoom icons to make the output fill the Nsight DL Designer screen
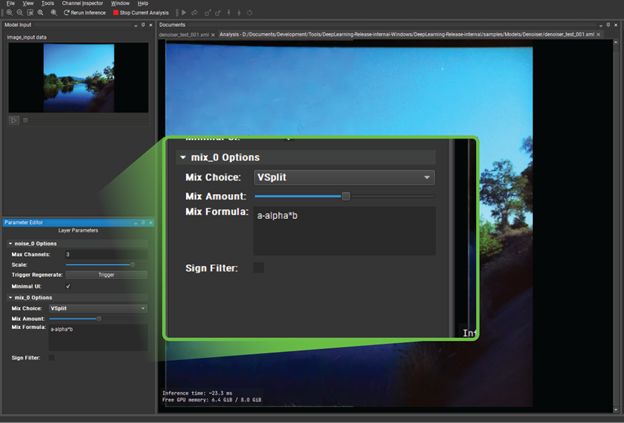
Under Mix Layer in the bottom left, change Mix Choice to V Split. When you drag the Mix Amount slider from left to right, you can see that you are actually getting a split screen between the original input and the reconstructed, denoised output. It is certainly useful, but the effect is quite subtle.
Figure 15. Using the Mix Layer option to create a split screen view
You could conclude that the denoiser is serving its purpose, but the differences are subtle. What can you do to get a clearer idea about which image parts are performing better than others?
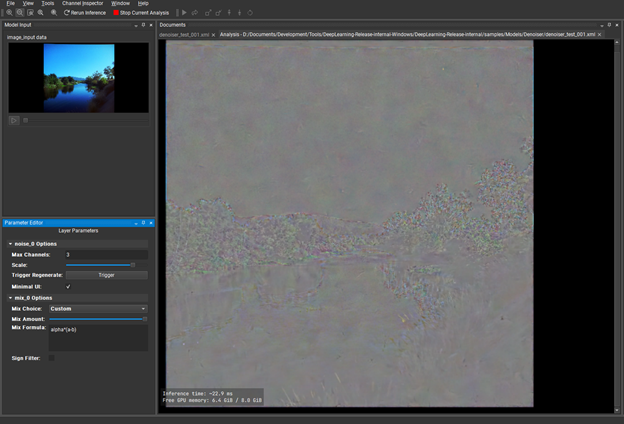
Under Mix Layer, change Mix Choice to Custom. For Mix Formula, replace the existing expression with: alpha * (a-b). The alpha keyword is effectively the normalized value of the slider and a and b are the two inputs of the layer. This creates a visual diff of the input and output that you can visually boost with the mix slider and tells you where there are fundamental differences between input and output.
This is the sort of thing that tells you, “Yes, your model is fine.” Or maybe, “You should revisit your architecture or training data.”
Figure 16. A visual diff of the input and output boosted by the Mix slider feature.
Conclusion
NVNsight DL Designer provides even more features, such as NvNeural, a highly optimized inference engine with an extensible plugin-based architecture that enables you to implement your own layer types.
Together with the design and analysis tools, DL Designer is a highly interactive and versatile solution to model design, reducing coding errors, and complexities to focus more on the capabilities and performance of your models.
For more information, see the following resources:

 Introducing the first GPU+DPU in a single package.
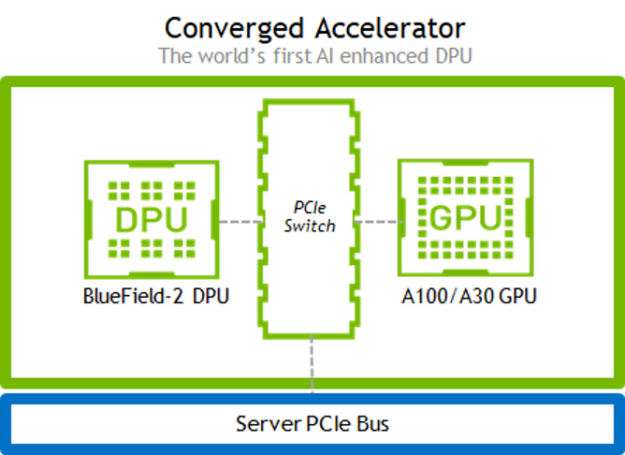
") Nsight Systems helps you tune and scale software across CPUs and GPUs.
Nsight Systems helps you tune and scale software across CPUs and GPUs.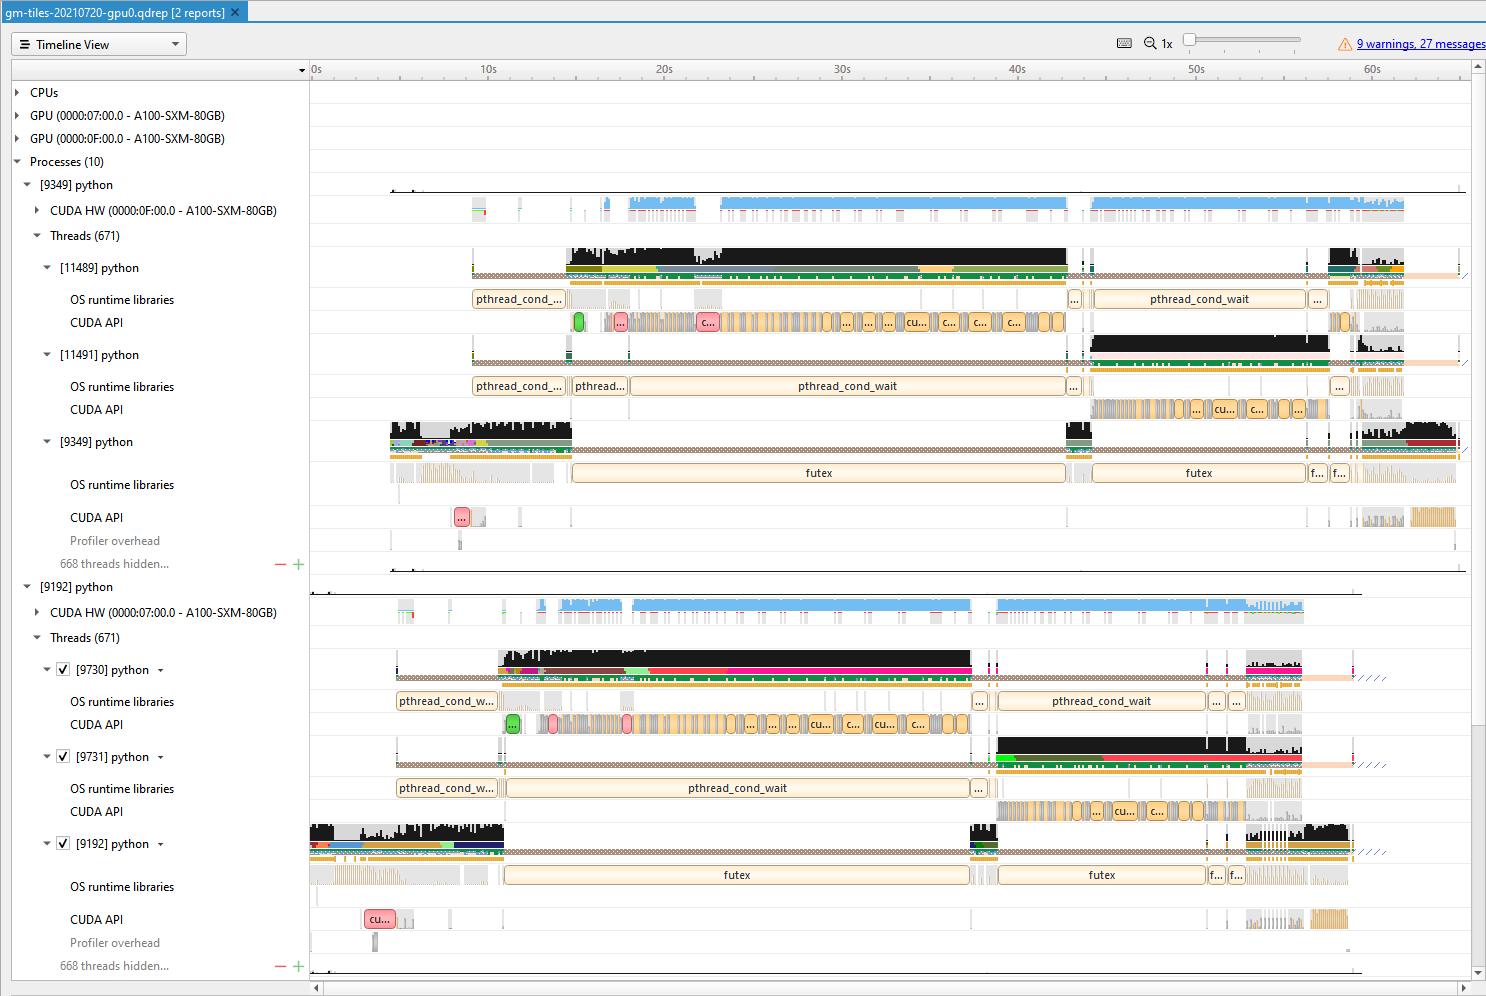

 Learn how building models with NVIDIA Data Science Workbench can improve management and increase productivity.
 ![NVIDIA Data Science Workbench connects to the NVIDIA GPU Cloud and is also connected to JupyterLab, PyTorch, TensorFlow, RAPIDS, and multiple CLIs including Kaggle, NGC, NVIDIA Data Science Stack, and AWS.The foundation of the diagram is the NVIDIA-Certified Data Science Workstation and OS which supports Drivers, CUDA, nv-docker, and Docker]](https://developer-blogs.nvidia.com/wp-content/uploads/2021/11/DSW_Pic1-1.png)
 container updates. Also, get notified about other important updates.
  NVIDIA announced the latest release in Nsight Graphics, which supports Direct3D, Vulkan, OpenGL, OpenVR, and the Oculus SDK.
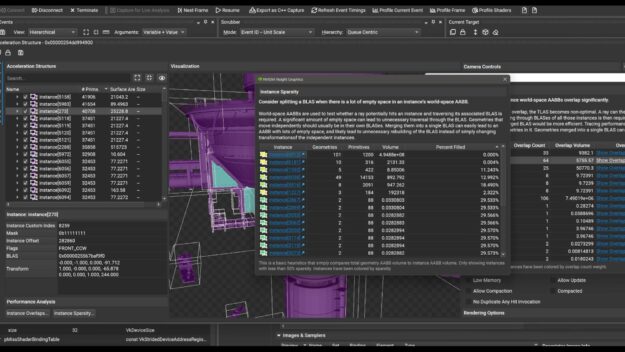
 Technical overview of the Nsight DL Designer tool to help ease the process of performant model design.